Kemiex Insights 3/3 - Trade Flows
Kemiex was founded in 2017 with the vision to connect all buyers and sellers of raw materials in the life-science industry through an all-in-one solution. The first product available to clients was the Marketplace, where companies could transact safely and efficiently using the tool. Over time, as a consequence of the growth in usage and after collecting feedback from many clients, we decided to develop a new solution that would allow users to visualize data to make better decisions: Kemiex Insights, which was first launched to clients in June 2019.
The following series will focus on explaining how Kemiex Insights supports companies to make better decisions on a daily basis. Since launching it in 2019, our team has worked tirelessly to continue improving the value delivered to our customers in every aspect. As of October 2022, we offer 3 different solutions related to Insights in the platform and in this third chapter of the series, we will explain the Trade Flows solution.
Trade Flows
What is it?
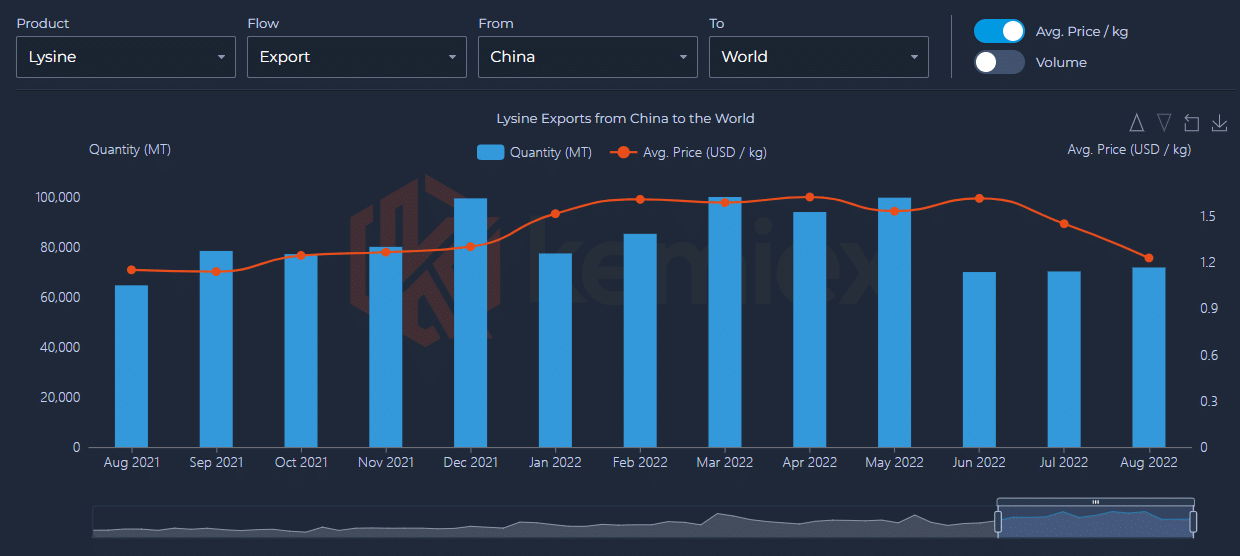
Trade Flows is a Kemiex feature launched on May 2022 that shows information reported by government authorities globally, regarding the quantities and volumes of products that were exported and imported worldwide. If used properly, the tool can help to understand global and regional changes in a few clicks.
You will find export and import data about more than 80 products, to more than 55 countries, since 2017. The data is updated every month as soon it’s made available by the respective government sources of each country in scope.
How to use it?
This feature can give you very valuable information if you know how to use it properly, and that’s why we are here today.

The tool allows thousands of combinations, so you can decide which information is more useful for you. You simply have to select one of the products available, the flow (import or export data), the country of origin of the goods, and the country of destination. The result will be the amount (in MT) and, optionally, the Total Volume (in EUR or USD) or the Average price/kg.
On the top right corner of the chart, you can click on the arrows to aggregate the data from months to quarters or to years and viceversa. Additionally, you can also find a button to download the image of the chart, in case you want to use it in your internal presentations or in discussions with stakeholders.
This feature will give you crucial information to understand markets and transaction flows globally. You will be able to identify trends and make your own forecasts and strategic decisions based on official data.

What is the origin of the data shown?
**The information on Trade Flows is obtained from official government sources based on official HS-8 code classifications, and is in no way created or modified by Kemiex. **
There are important limitations concerning product definition on such official government sources based on HS-8 Code classifications (e.g., Vit C vs Vit C 35% are within the same HS-8 Code). Another limitation applies to different grades or sources. Unfortunately, it’s not possible to disaggregate this information.
With regards to the average prices of products that we display, you need to consider:
-
Average Prices: Calculated from the Total Volume / Quantity
-
Timing: These are the officially reported values of goods leaving or entering the borders of a country during a specific month. Official sources are usually reported with some delay, which can range between 1 and up to 6 months, and which are out of what Kemiex can control.
-
Big contracts and intra-group transactions: In these numbers, you might also have exported goods included for multinational companies, who can have multi-year agreements at significantly discounted prices compared to the rest of participants, or transfer of goods between entities of the group and a cost price.
__
Disclaimer
Research content and market data by Kemiex AG (“Kemiex”) are for informational purposes and authorised members of its community only. Kemiex does not take any raw materials positions or stocks and we are committed to providing strategic and balanced market insights to Buyers and Sellers alike. Kemiex does not warrant that its market data reports are accurate or complete and hence, it should not be relied upon as such. The data is subject to change without any prior notice. Opinions expressed herein are our current opinions as on the date of this report. Nothing in this market data reports constitute purchasing, selling, trade, investment, legal, accounting or tax advice or any solicitation, whatsoever. Subscribers / readers assume the entire risk of any use made of this data. Kemiex clearly states that it has no financial liability whatsoever to the subscribers / readers of this report. All rights reserved. Any form of publication, reproduction, copying or disclosure of the content is not permitted.
__
Find out the previous chapters of the serie by clicking on the link of the Price Trends and Market News. You can also see the full serie here