Your Digital Gateway to the Global Vitamin Market Prices Platform
Vitamin Price Benchmarks Intelligence Platform
Weekly min, avg and max price ranges for feed, food and pharma grade vitamins.
Built for procurement teams that need to know if their quotes are fair.
Trusted by 9,000+ industry professionals worldwide
Providing data-driven insights to 9000+ customers in 95+ countries
Stop accepting vitamin quotes at face value
Why your vitamin procurement costs more than it should
Most buyers rely on two or three supplier quotes to gauge the market. That is not enough data to negotiate well.
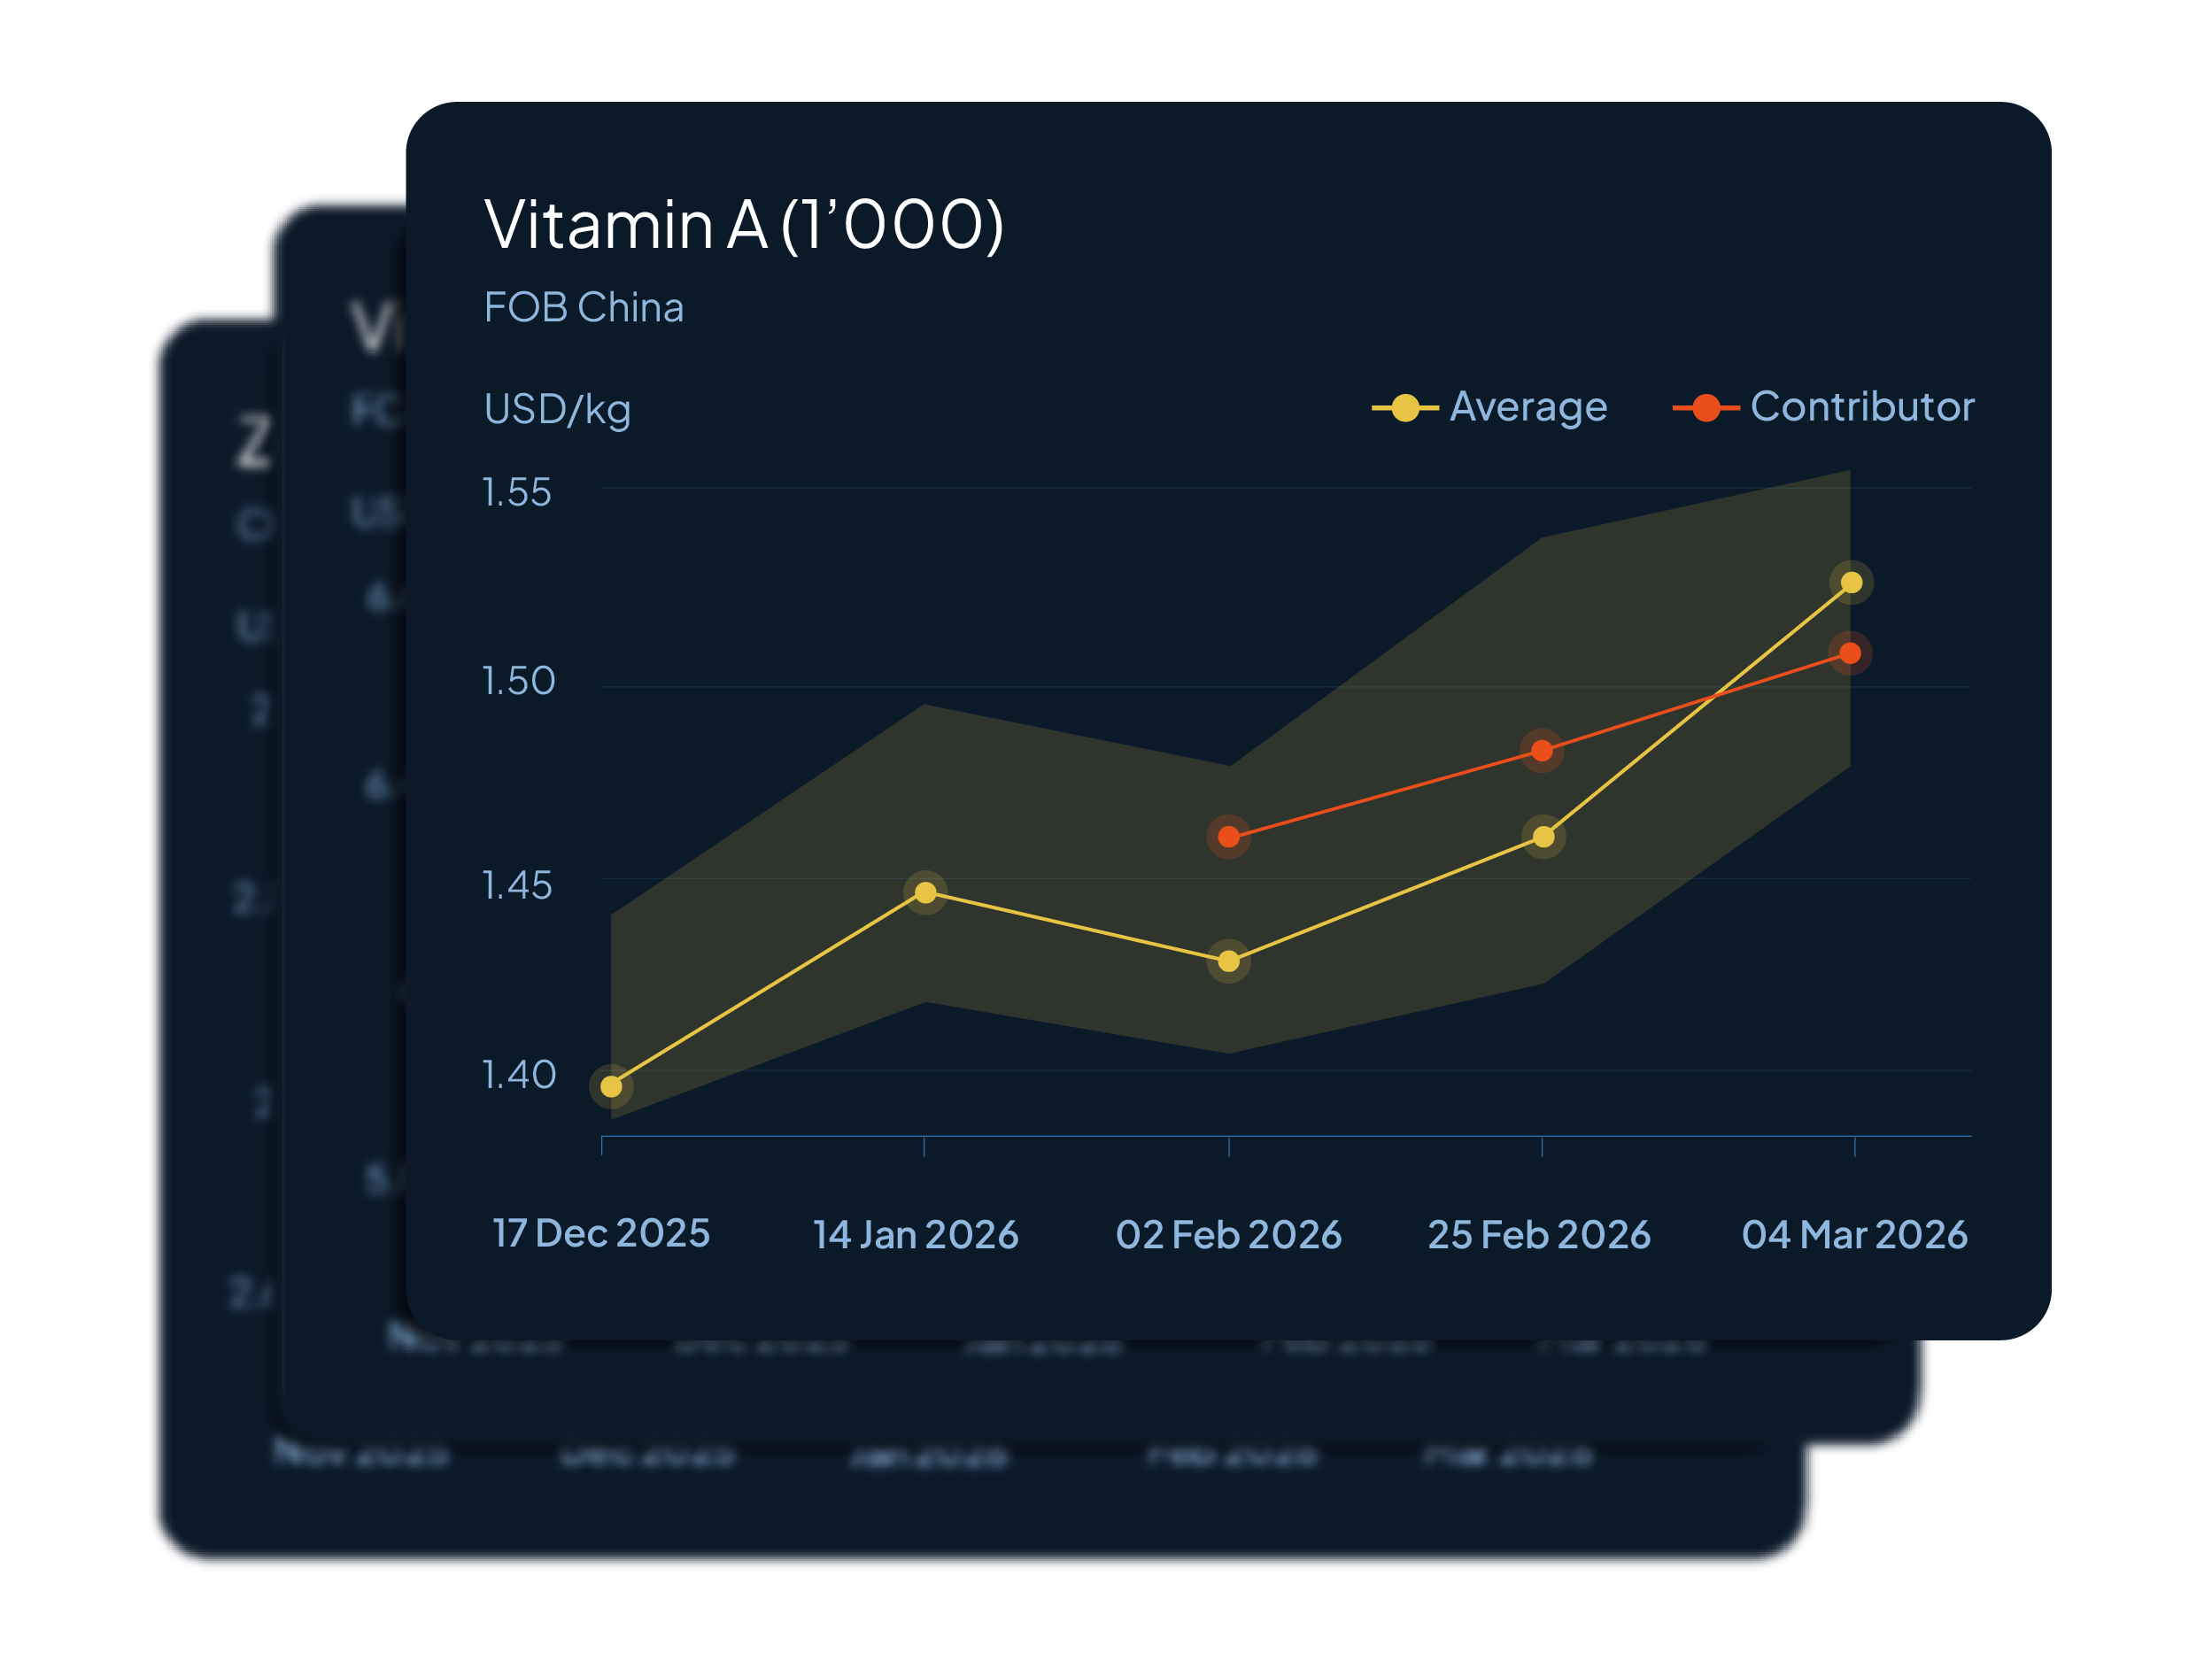
Vitamin A and E prices can swing 30% in a single quarter. Without weekly benchmarks, you are always reacting instead of planning.
Your suppliers know the market better than you do. Benchmarks close that information gap.
What changes when you benchmark every purchase
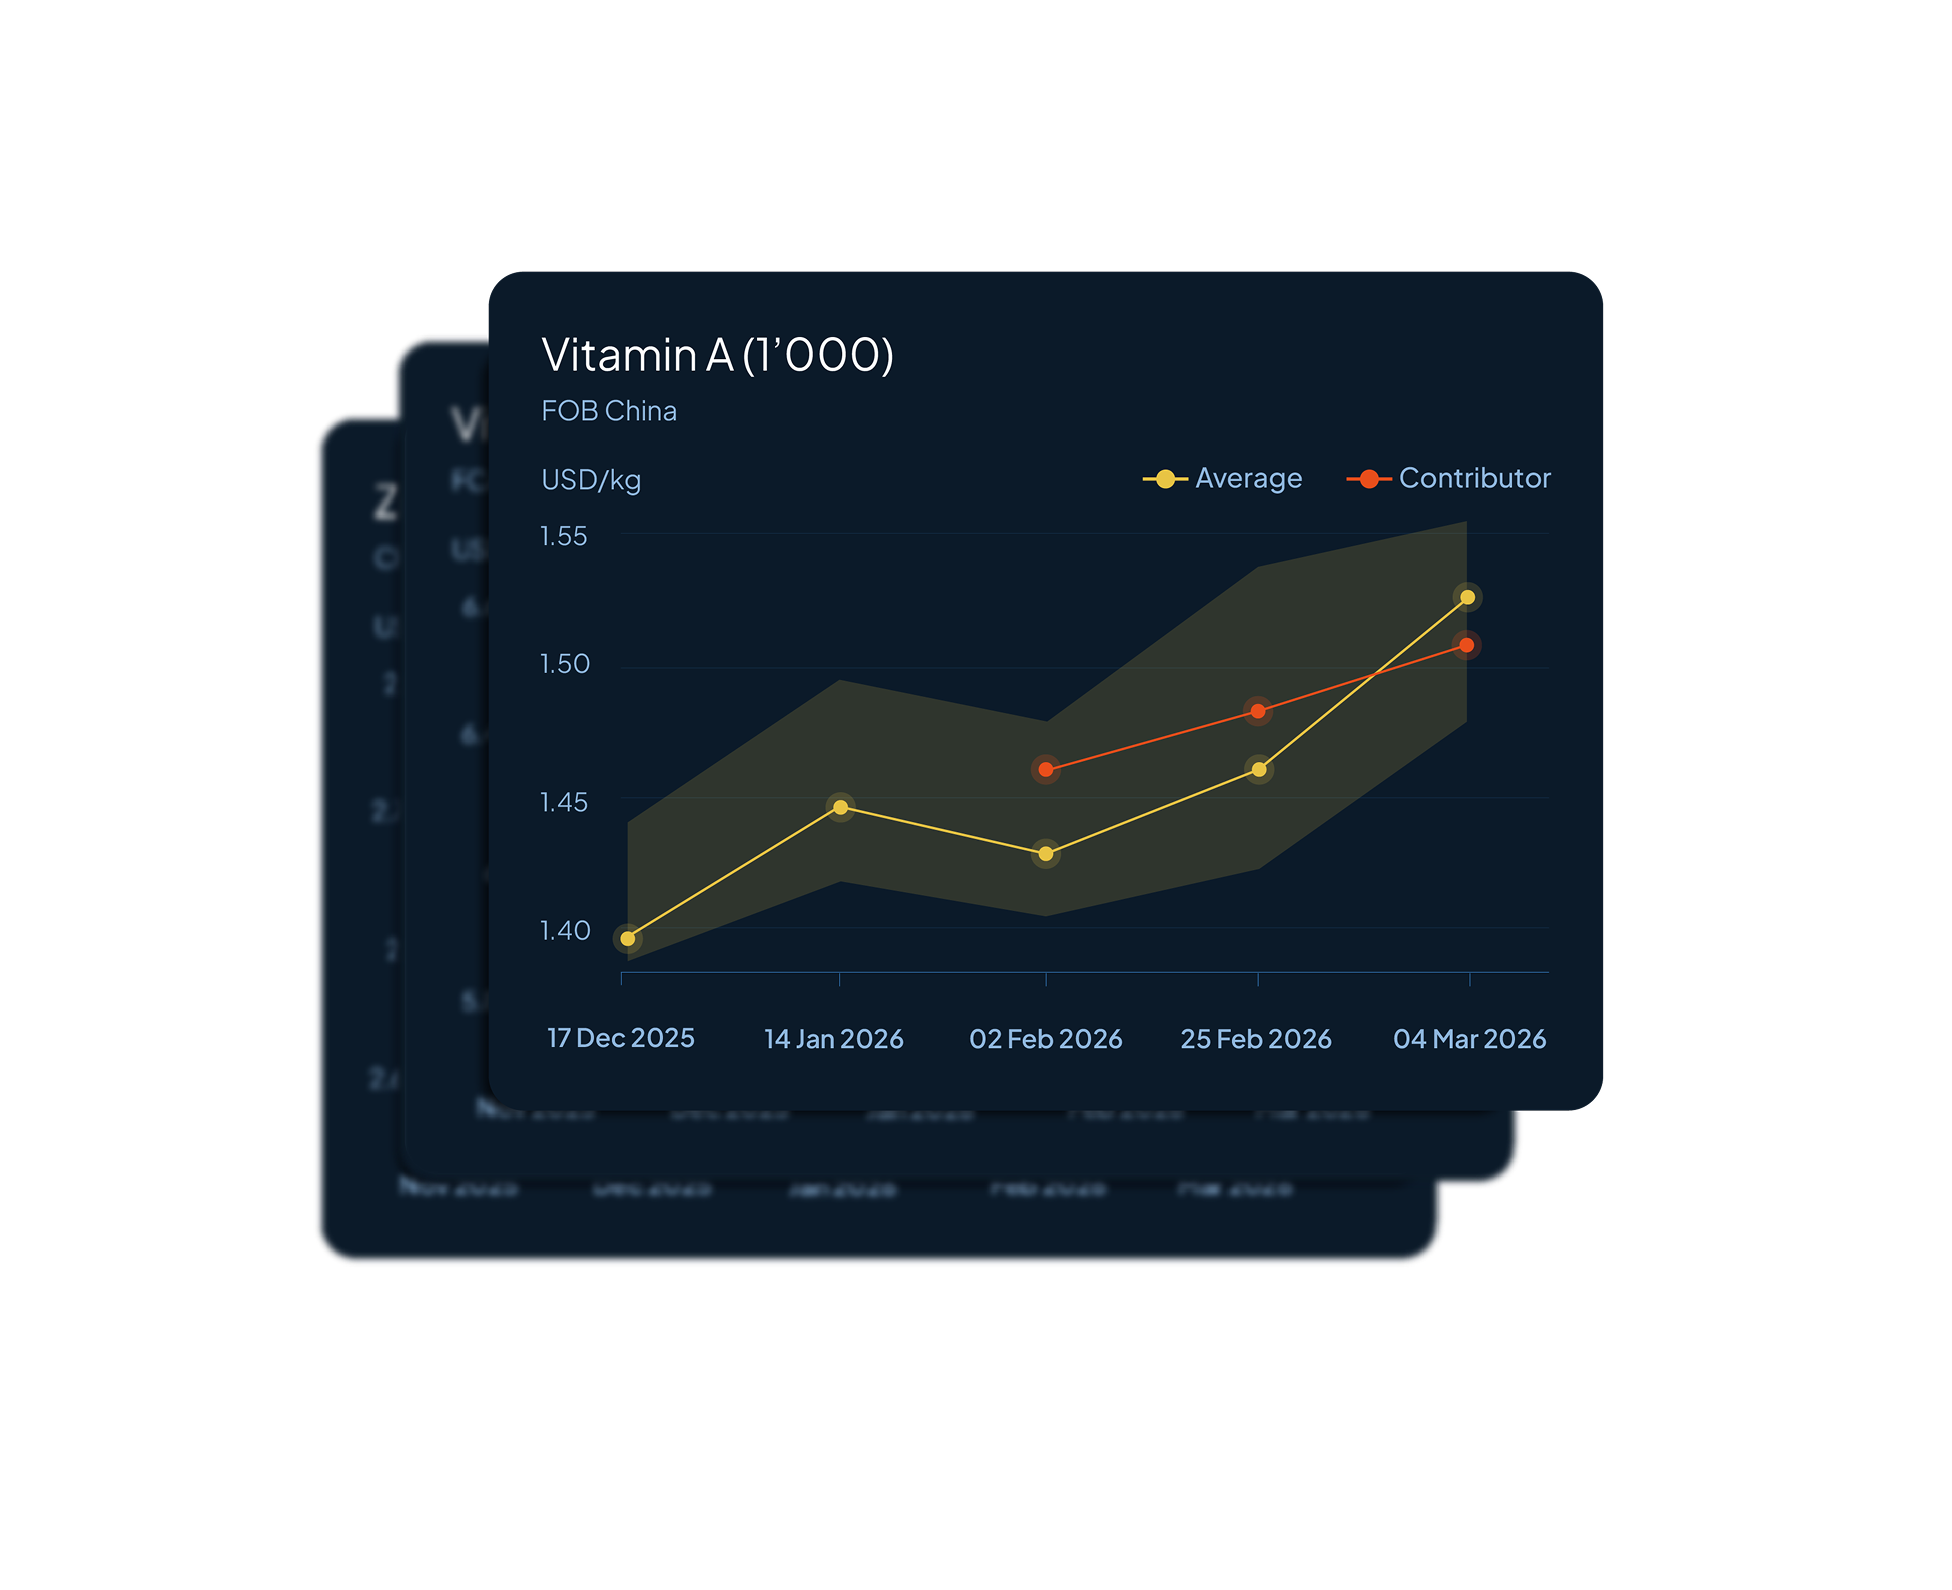
Paste a Vitamin A, E, D3 or B-complex quote into the platform and instantly see if it falls within, above or below the current weekly range
Flag overpriced offers before signing. One rejected quote can save more than a full year of the platform fee
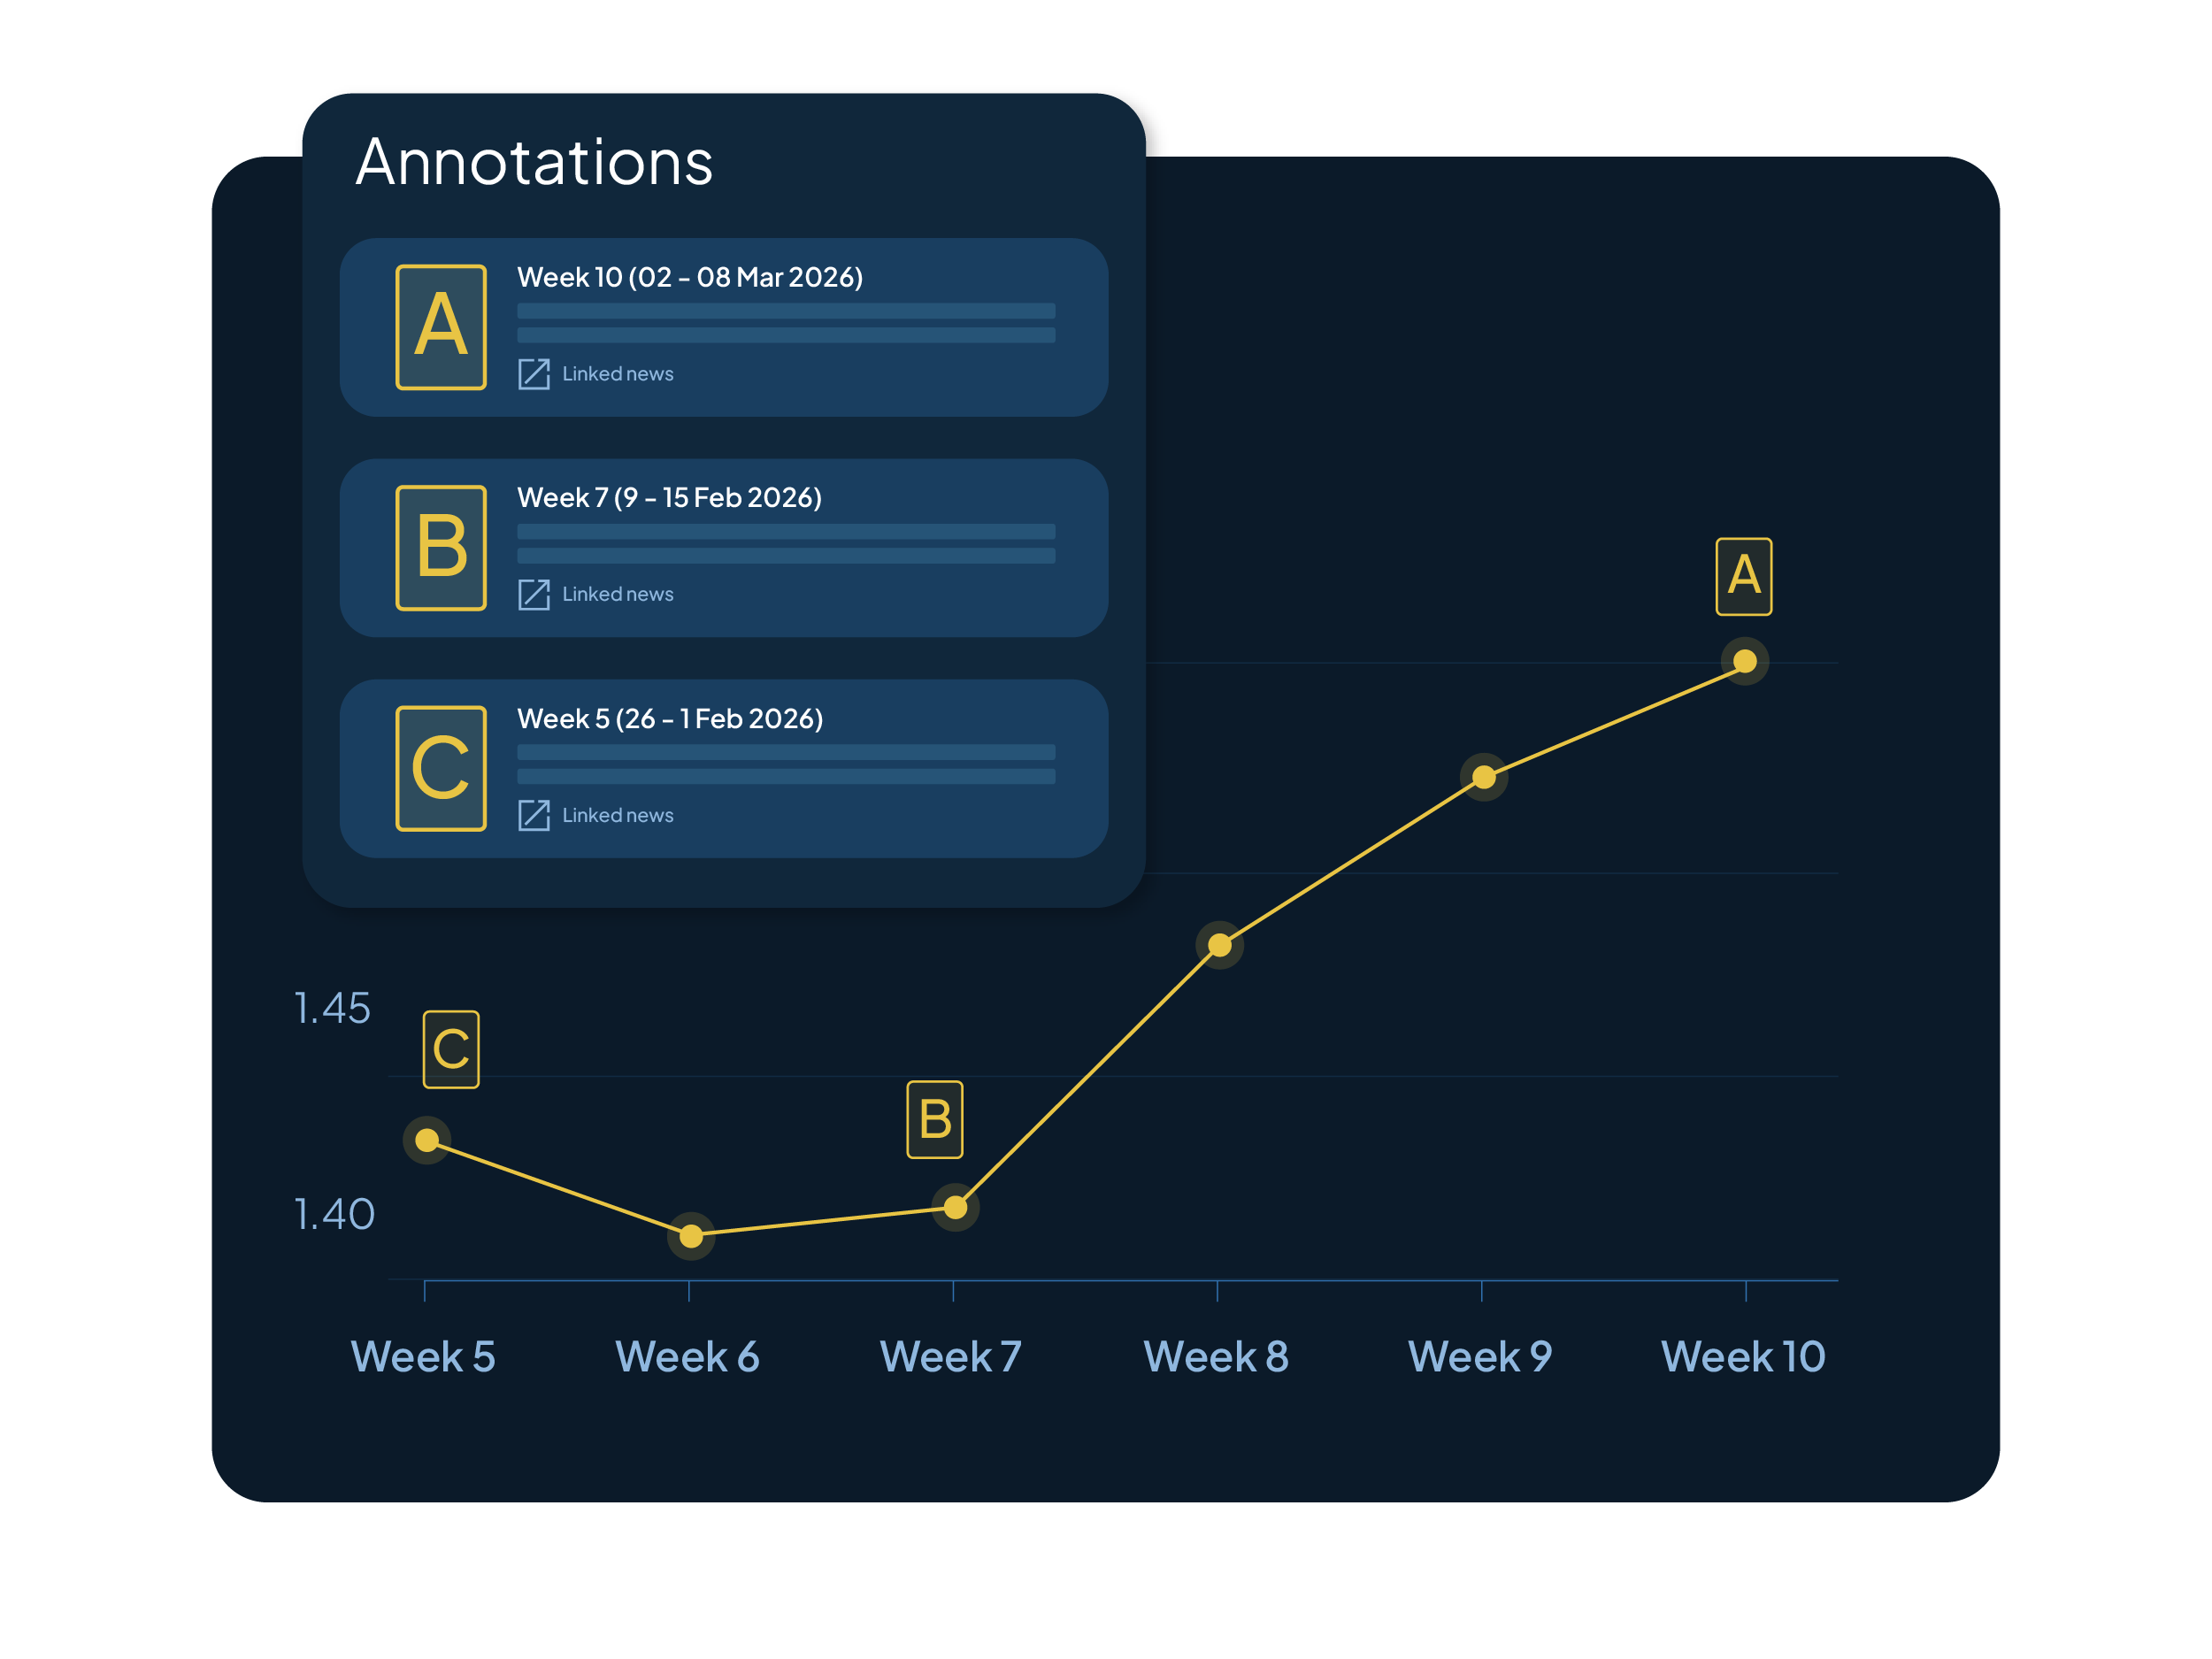
Build a 12-month cost history for each vitamin to spot seasonal patterns and lock in volume at the right time
Interactive Price Charts
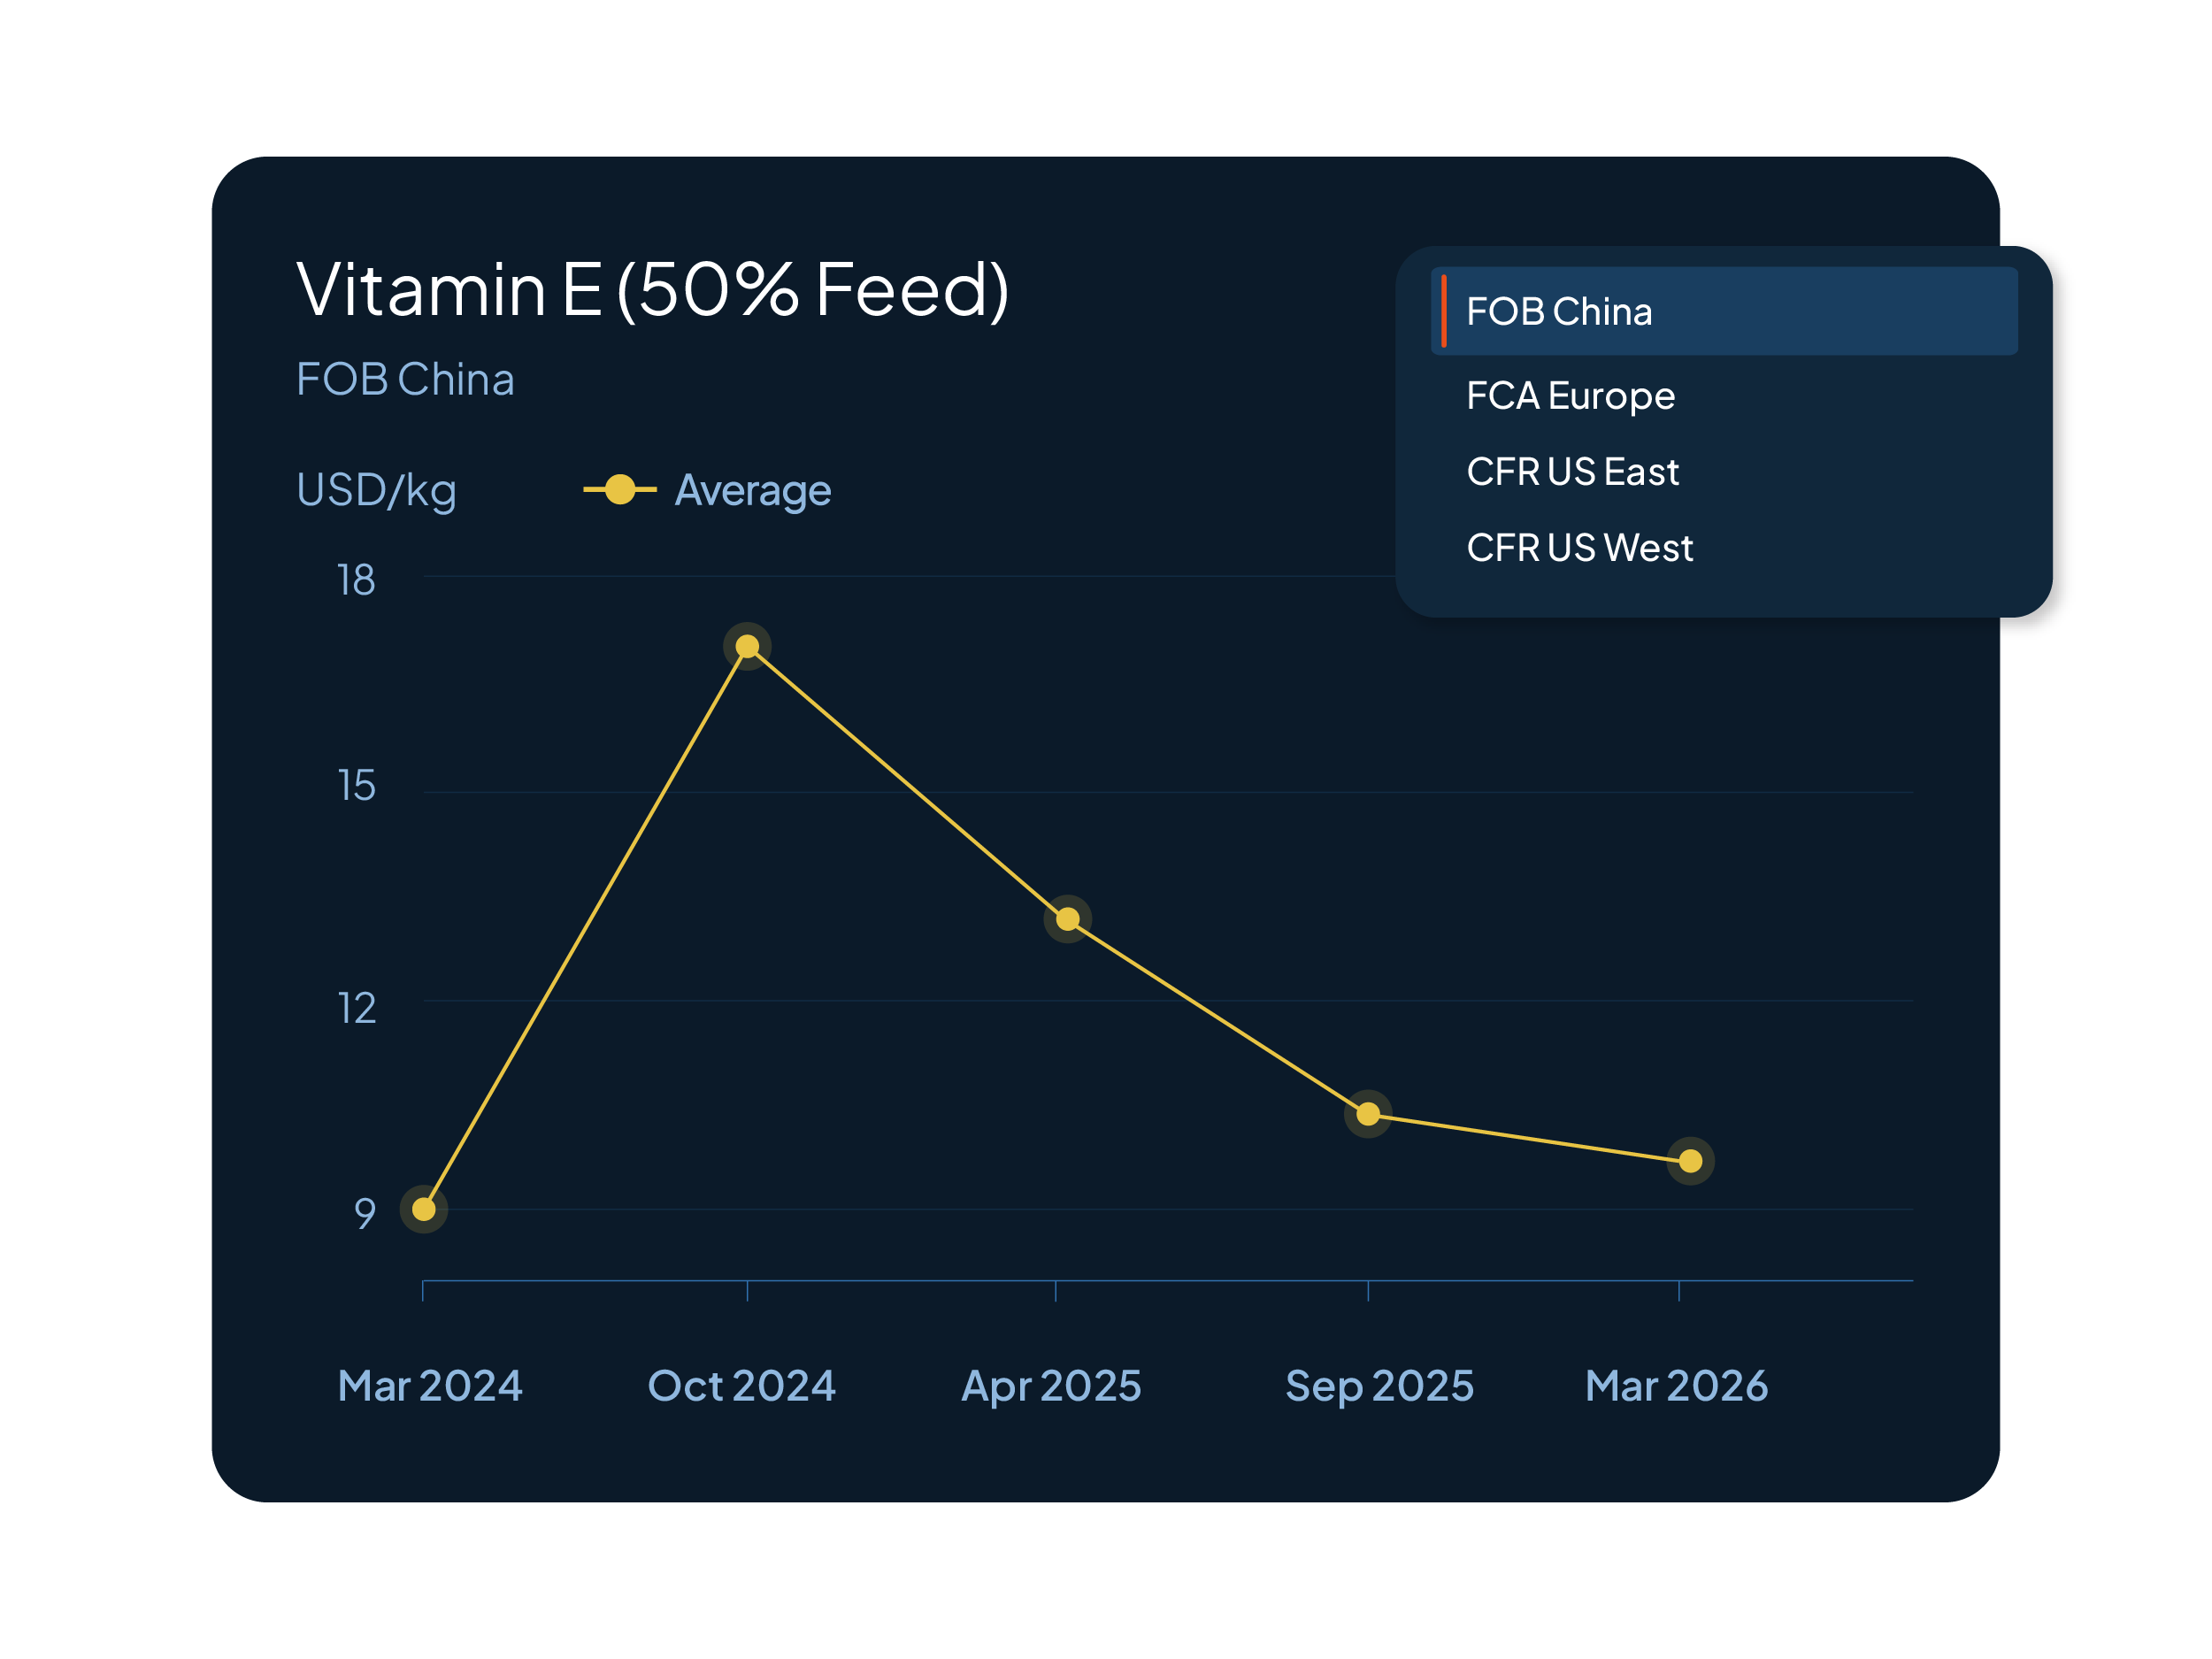
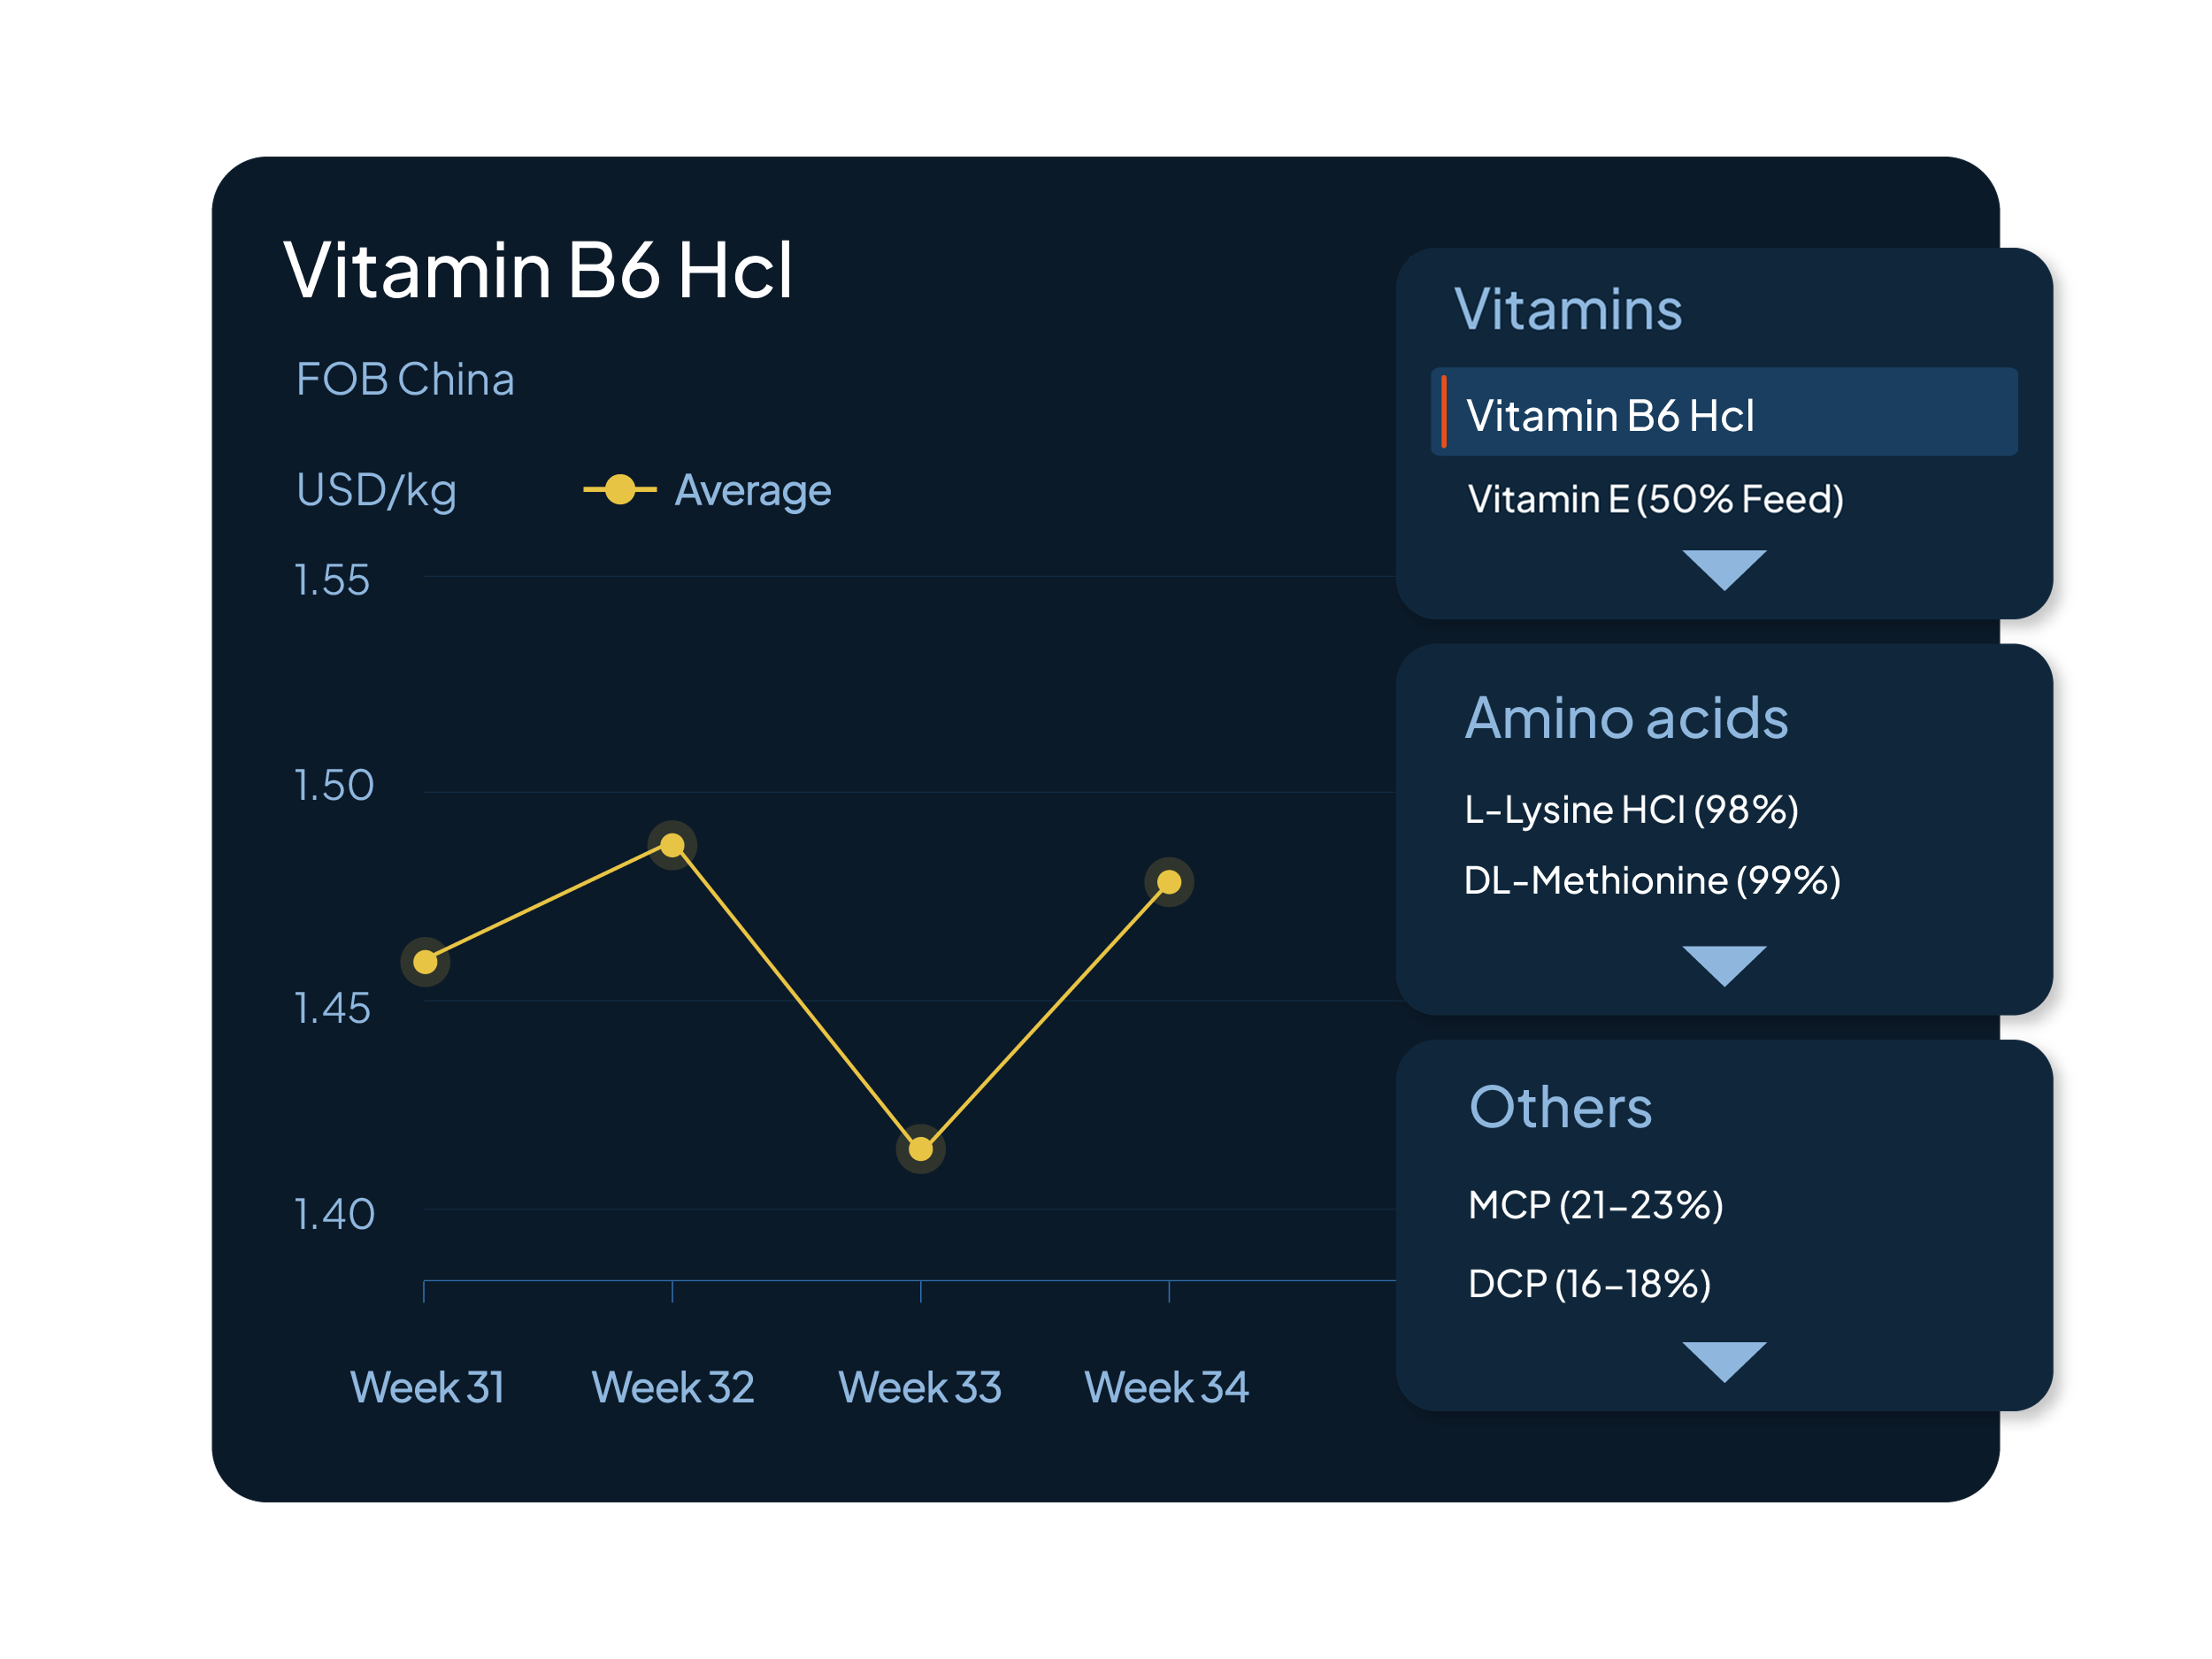
Filter by vitamin, region, and time period (3M, 6M, 1Y, 2Y, 5Y)
Benchmarking coverage across the full vitamin price comparison tool
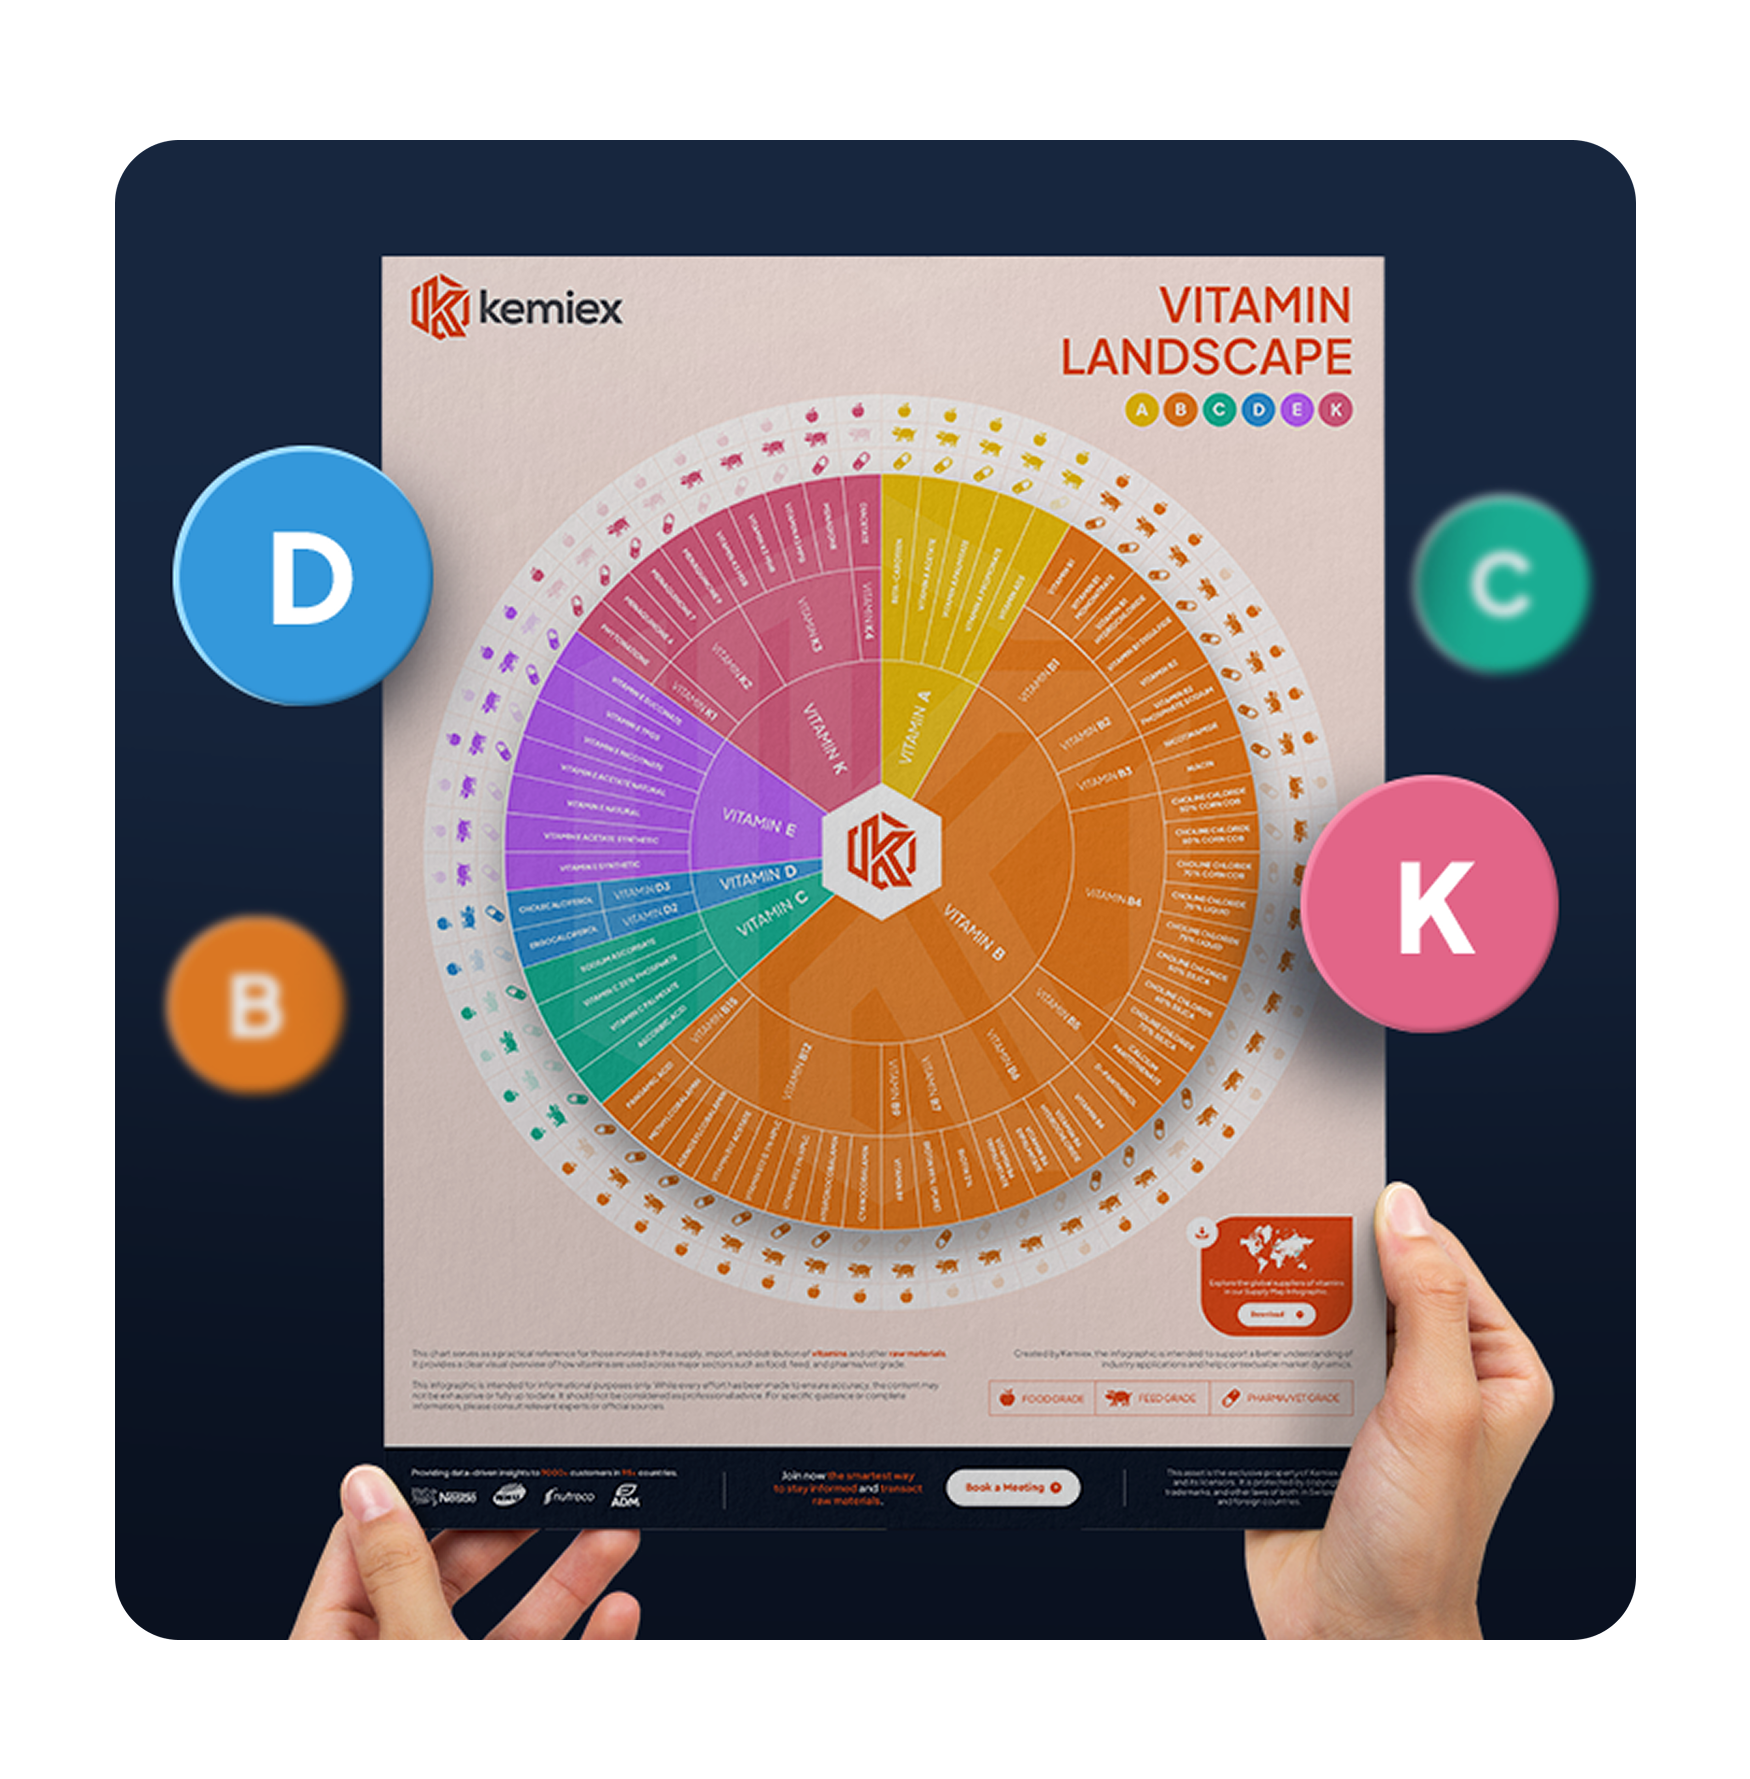
B-Complex Vitamins
B1 (Mononitrate / HCl), B2 (Riboflavin), B3 (Niacin / Niacinamide), B5 (Calcium Pantothenate), B6, B9 (Folic Acid), B12, Biotin
Essential Vitamins
Vitamin A (Retinol / Acetate), Vitamin C (Ascorbic Acid), Vitamin C 35% phosphate, Vitamin D3, Vitamin E (50% Feed Grade), Vitamin K3 (MNB / MSB)
Feed, food and pharma grades tracked separately so your comparison is grade-specific
Historical data available for download to run your own internal cost analyses
Three steps to benchmark your next vitamin purchase
- Select the vitamin and grade you are buying. Choose your delivery region.
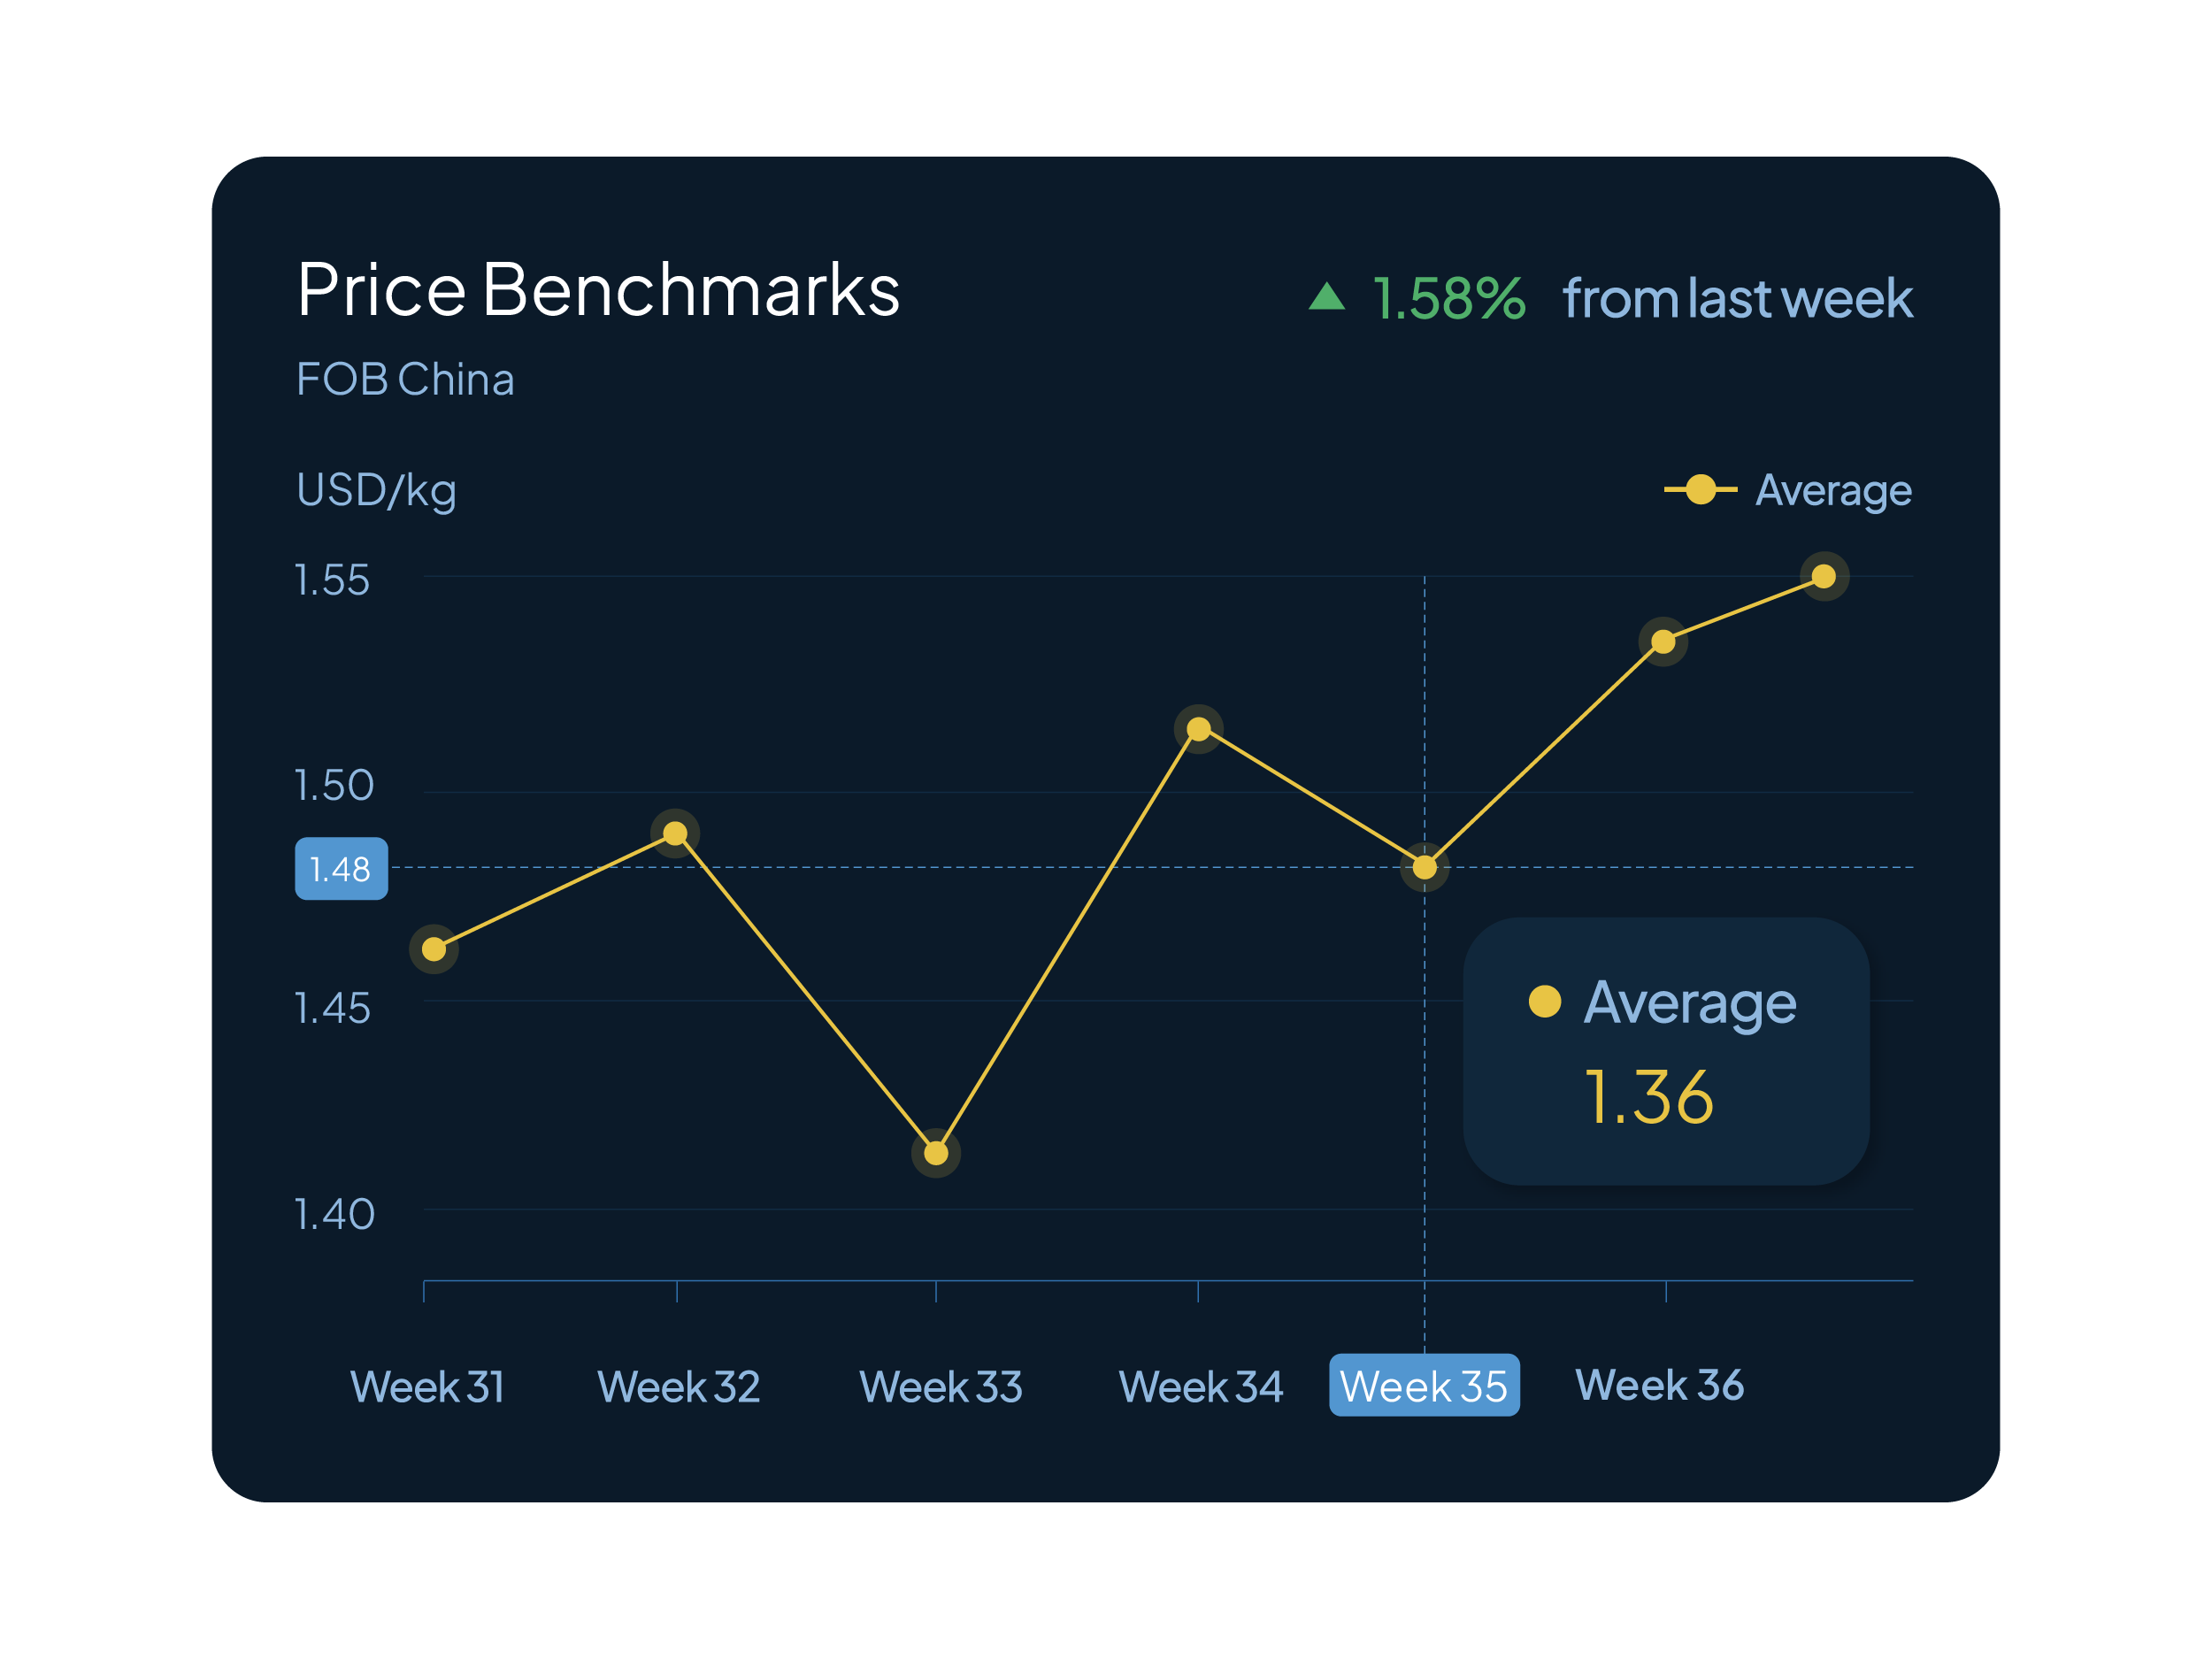
- See the current weekly range: minimum, average and maximum reported transaction prices.
- Compare your open quote against the range. Share the data with your supplier if needed.
How Kemiex Vitamin Price Benchmarks Work
Crowdsourced from verified transactions across the supply chain, not surveys or estimates
Methodology developed together with CME Group to ensure data integrity
Updated every week with min, avg and max ranges per vitamin, per region
Covers FOB China, FCA Europe, and delivered US (East and West coast)
How is this different from the Vitamin Market Prices page?
The market prices page gives you a broad view of where vitamin prices are heading and what is driving them. This benchmarks page is a procurement tool: it shows you the exact weekly price range so you can check if a specific quote is competitive.
Where does the pricing data come from?
From verified, crowdsourced contributions by buyers and sellers across the global vitamin supply chain. The methodology was built with CME Group.
Can I benchmark quotes for specific vitamin grades?
Yes. Feed grade, food grade and pharma grade vitamins are tracked separately. Your benchmark comparison will match the grade you are actually purchasing.
How often are vitamin benchmarks updated?
Every week. You receive fresh min, avg and max price ranges each Monday covering the previous trading week.