
Trade Flows: See Where Raw Materials Are Moving Before Your Supply Chain Feels It
Global import and export data structured into one interactive view, updated monthly.
Why This Matters
Limited visibility into global supply chains makes it difficult to track cross-border trade volumes, monitor pricing signals, and understand how products move between markets.
Because trade data is fragmented across sources and regions, building a clear picture of global supply and demand dynamics often requires significant time and manual analysis.
Trade Flows consolidates this information into a structured, easy-to-navigate view of global trade activity.
How it works
Trade Flows transforms complex global trade data into clear visual insights, turning raw datasets into actionable market intelligence.
1. Trade data is collected
Import and export data is gathered from multiple international official sources to capture global trade activity.
2. Data is cleaned and structured
Raw datasets are processed to align formats and country reporting structures, ensuring consistency across markets.
3. Data is visualized through interactive charts
Structured information is presented through interactive charts allowing users to explore trade volumes by product, country, or time period, fully customisable in just a few clicks.
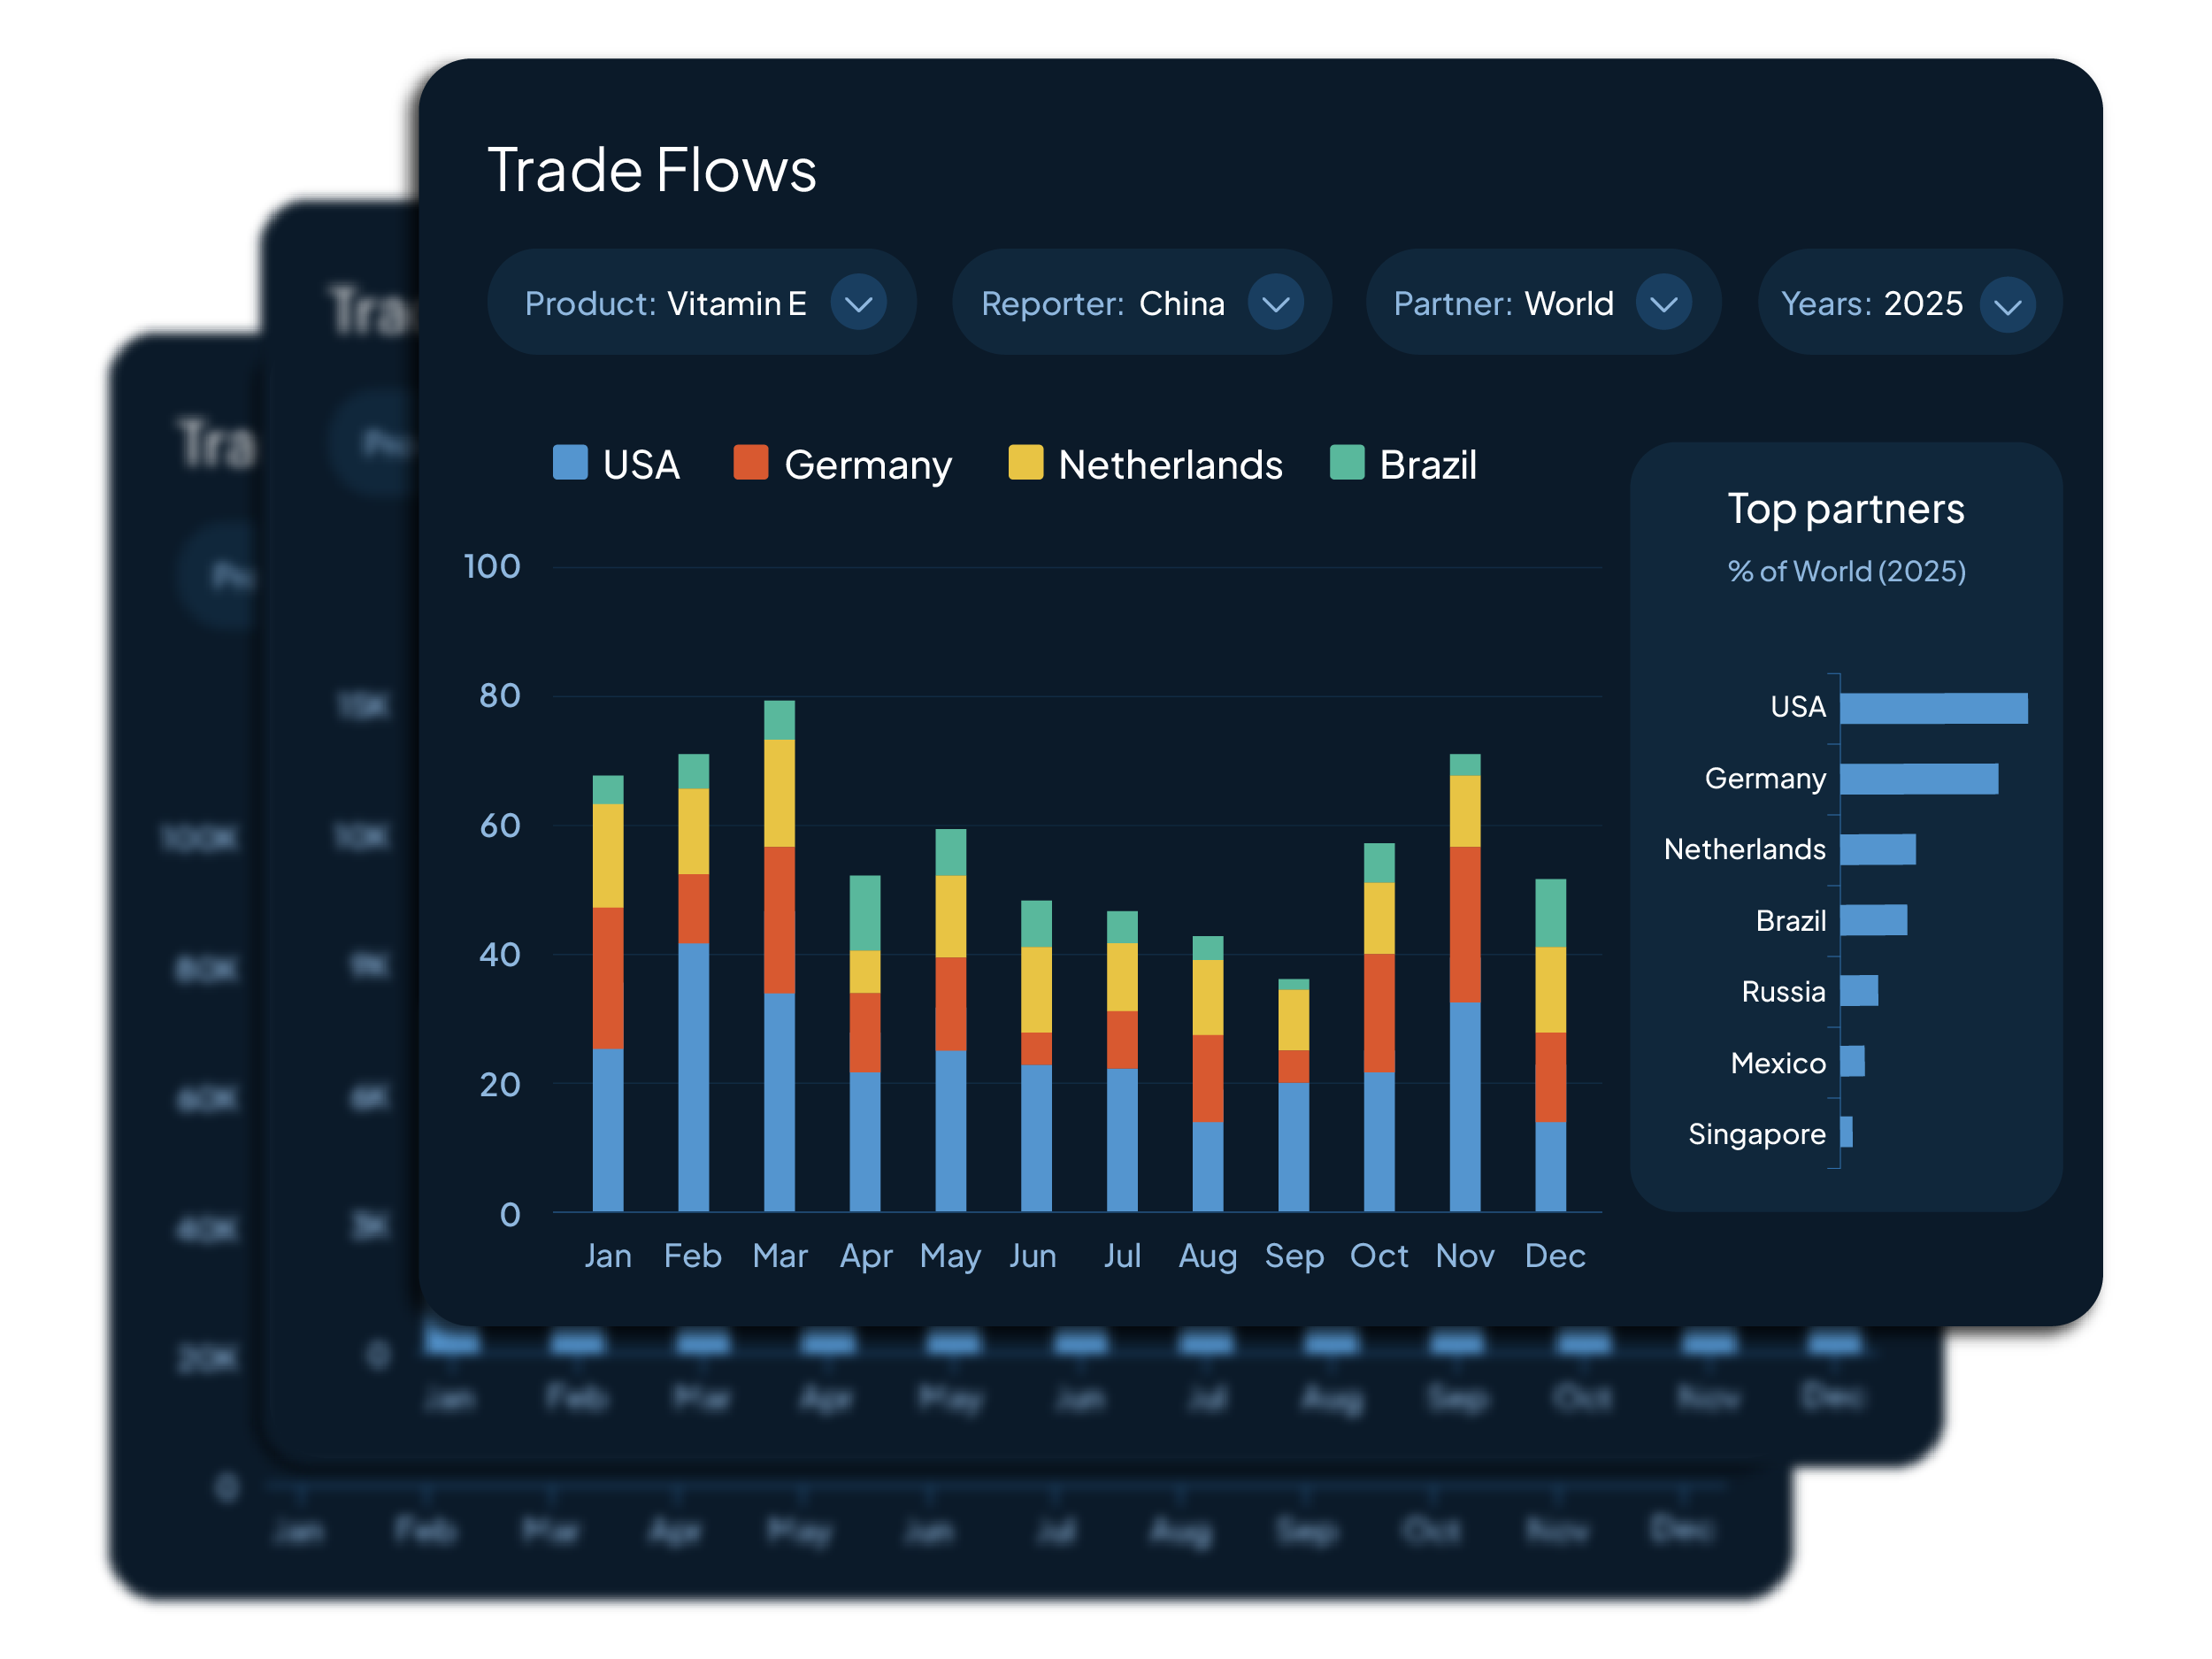
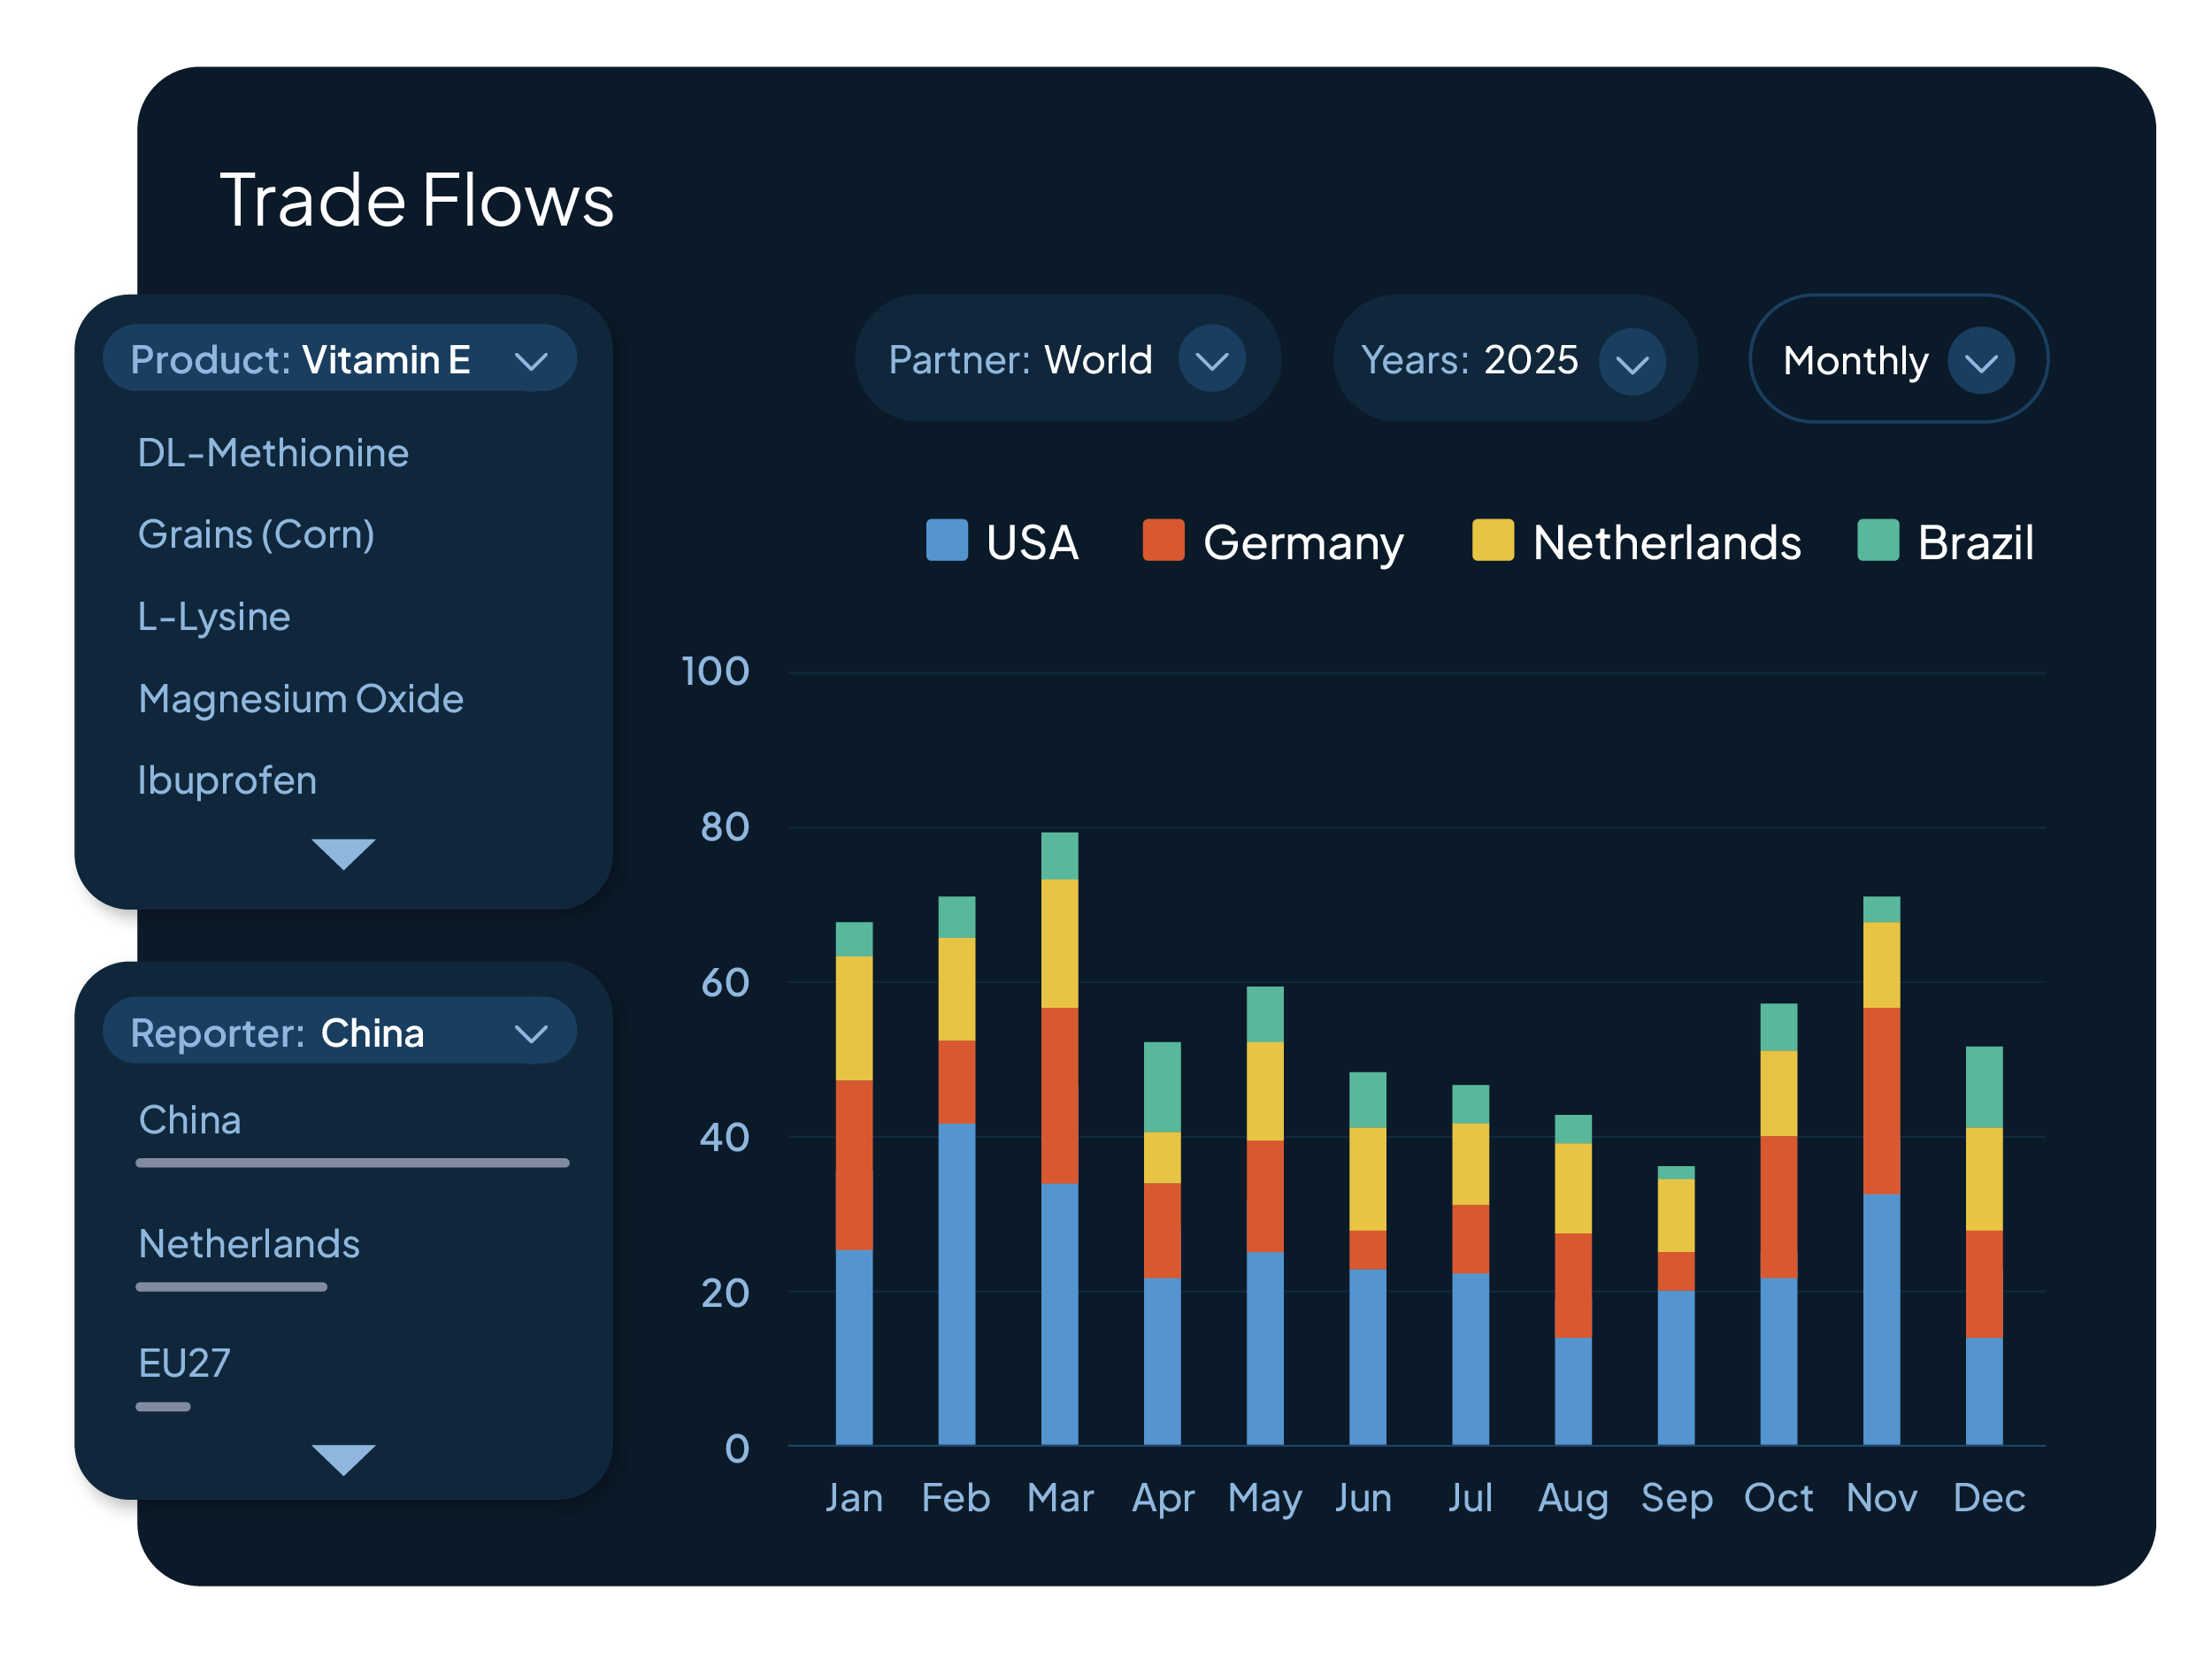
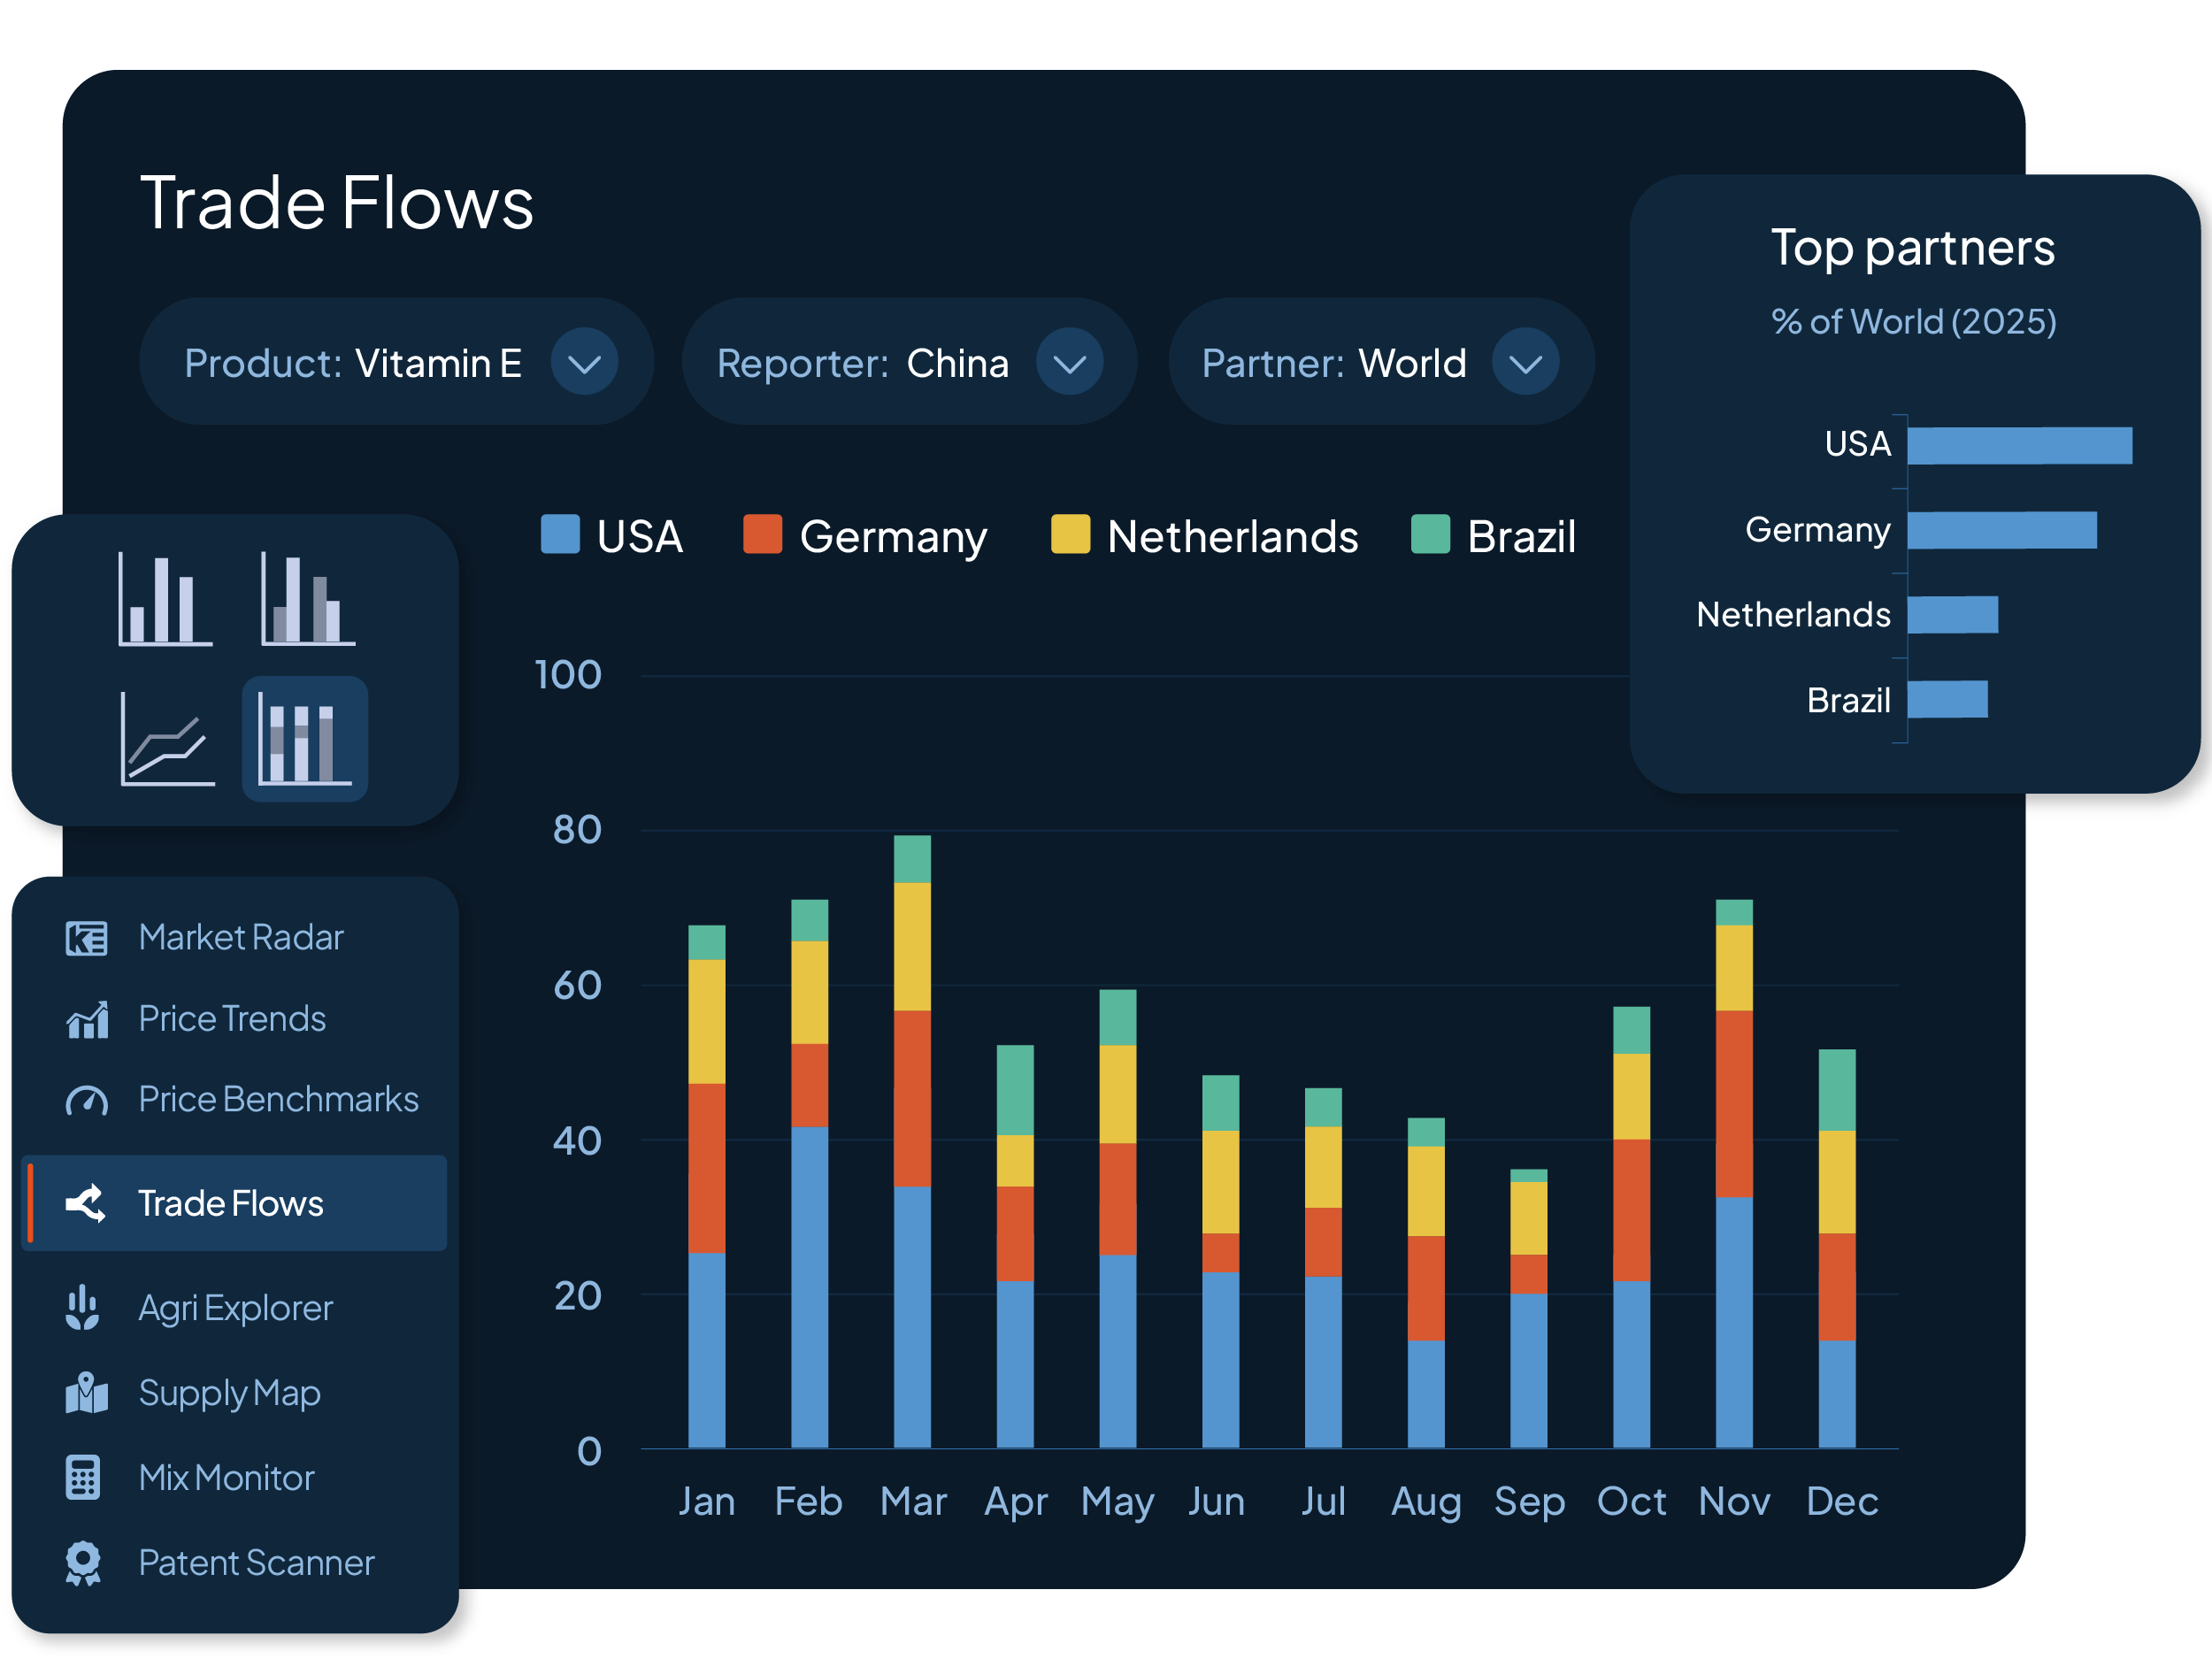
Market Filters
Explore how products move between markets and which countries play key roles in global supply.
Filter by:
-
Product
-
Reporting country
-
Trading partner
Historical import and export volumes can also be examined across multiple years to understand how markets develop and how trade patterns change over time.
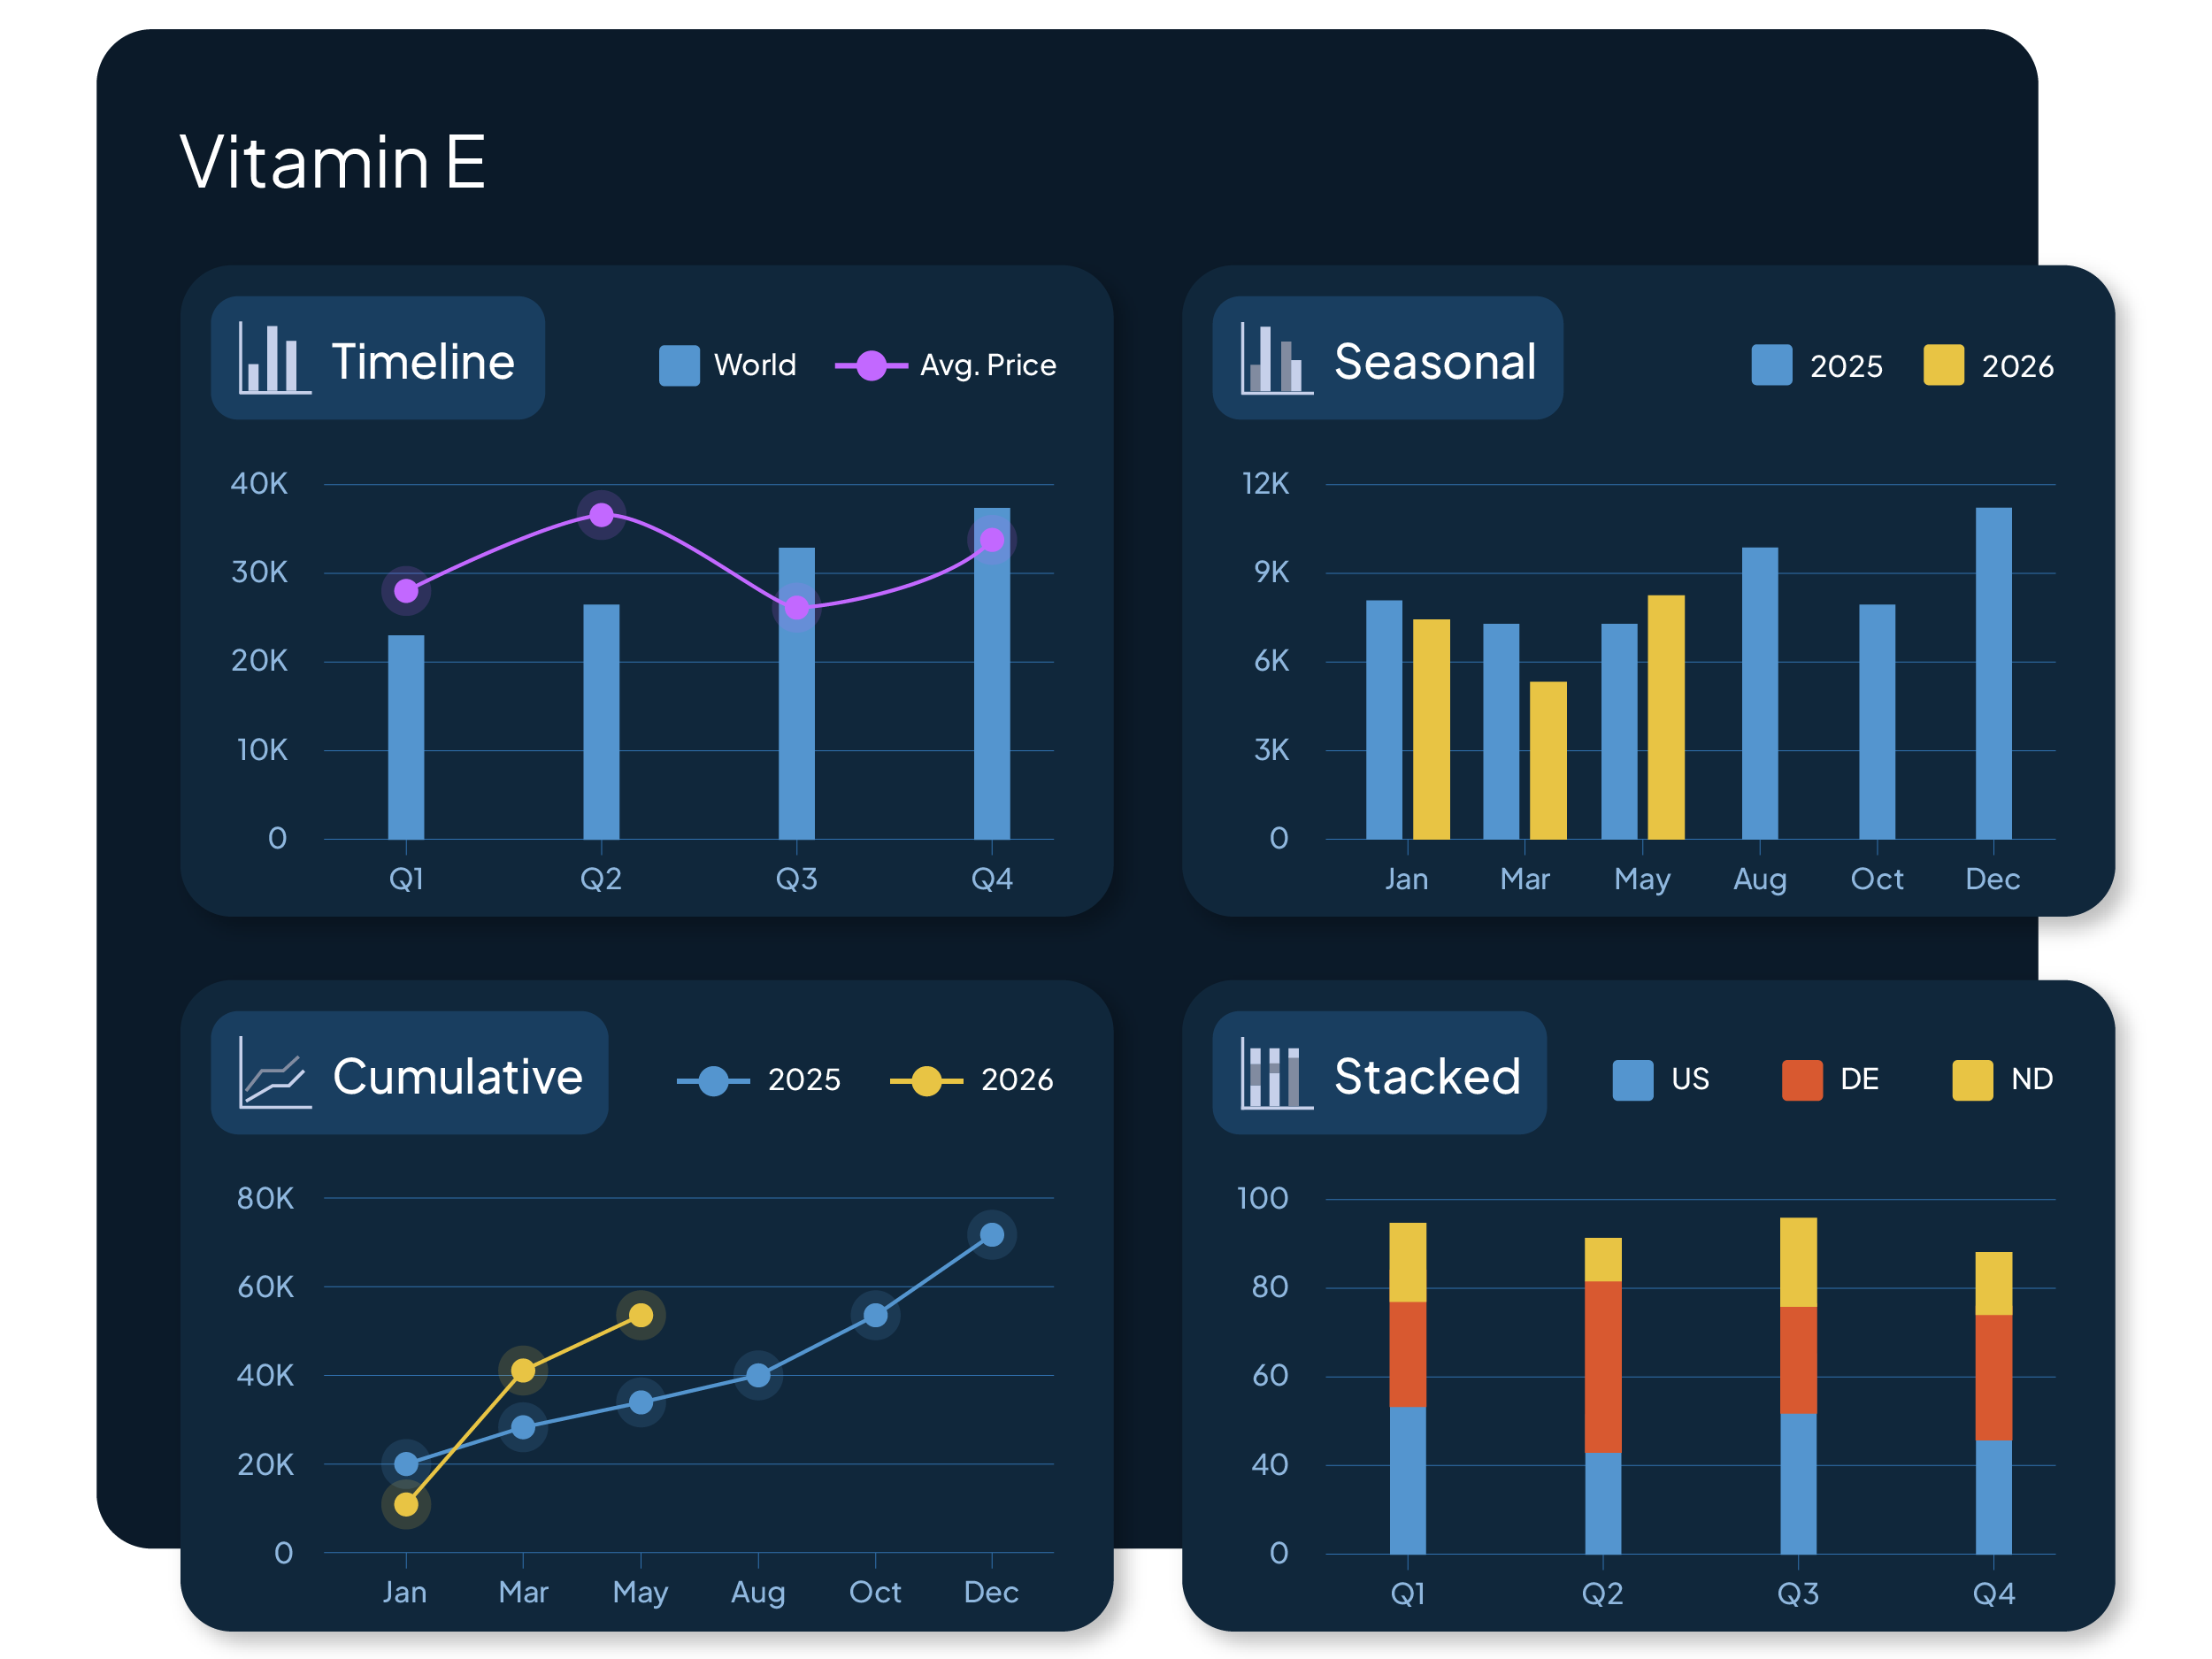
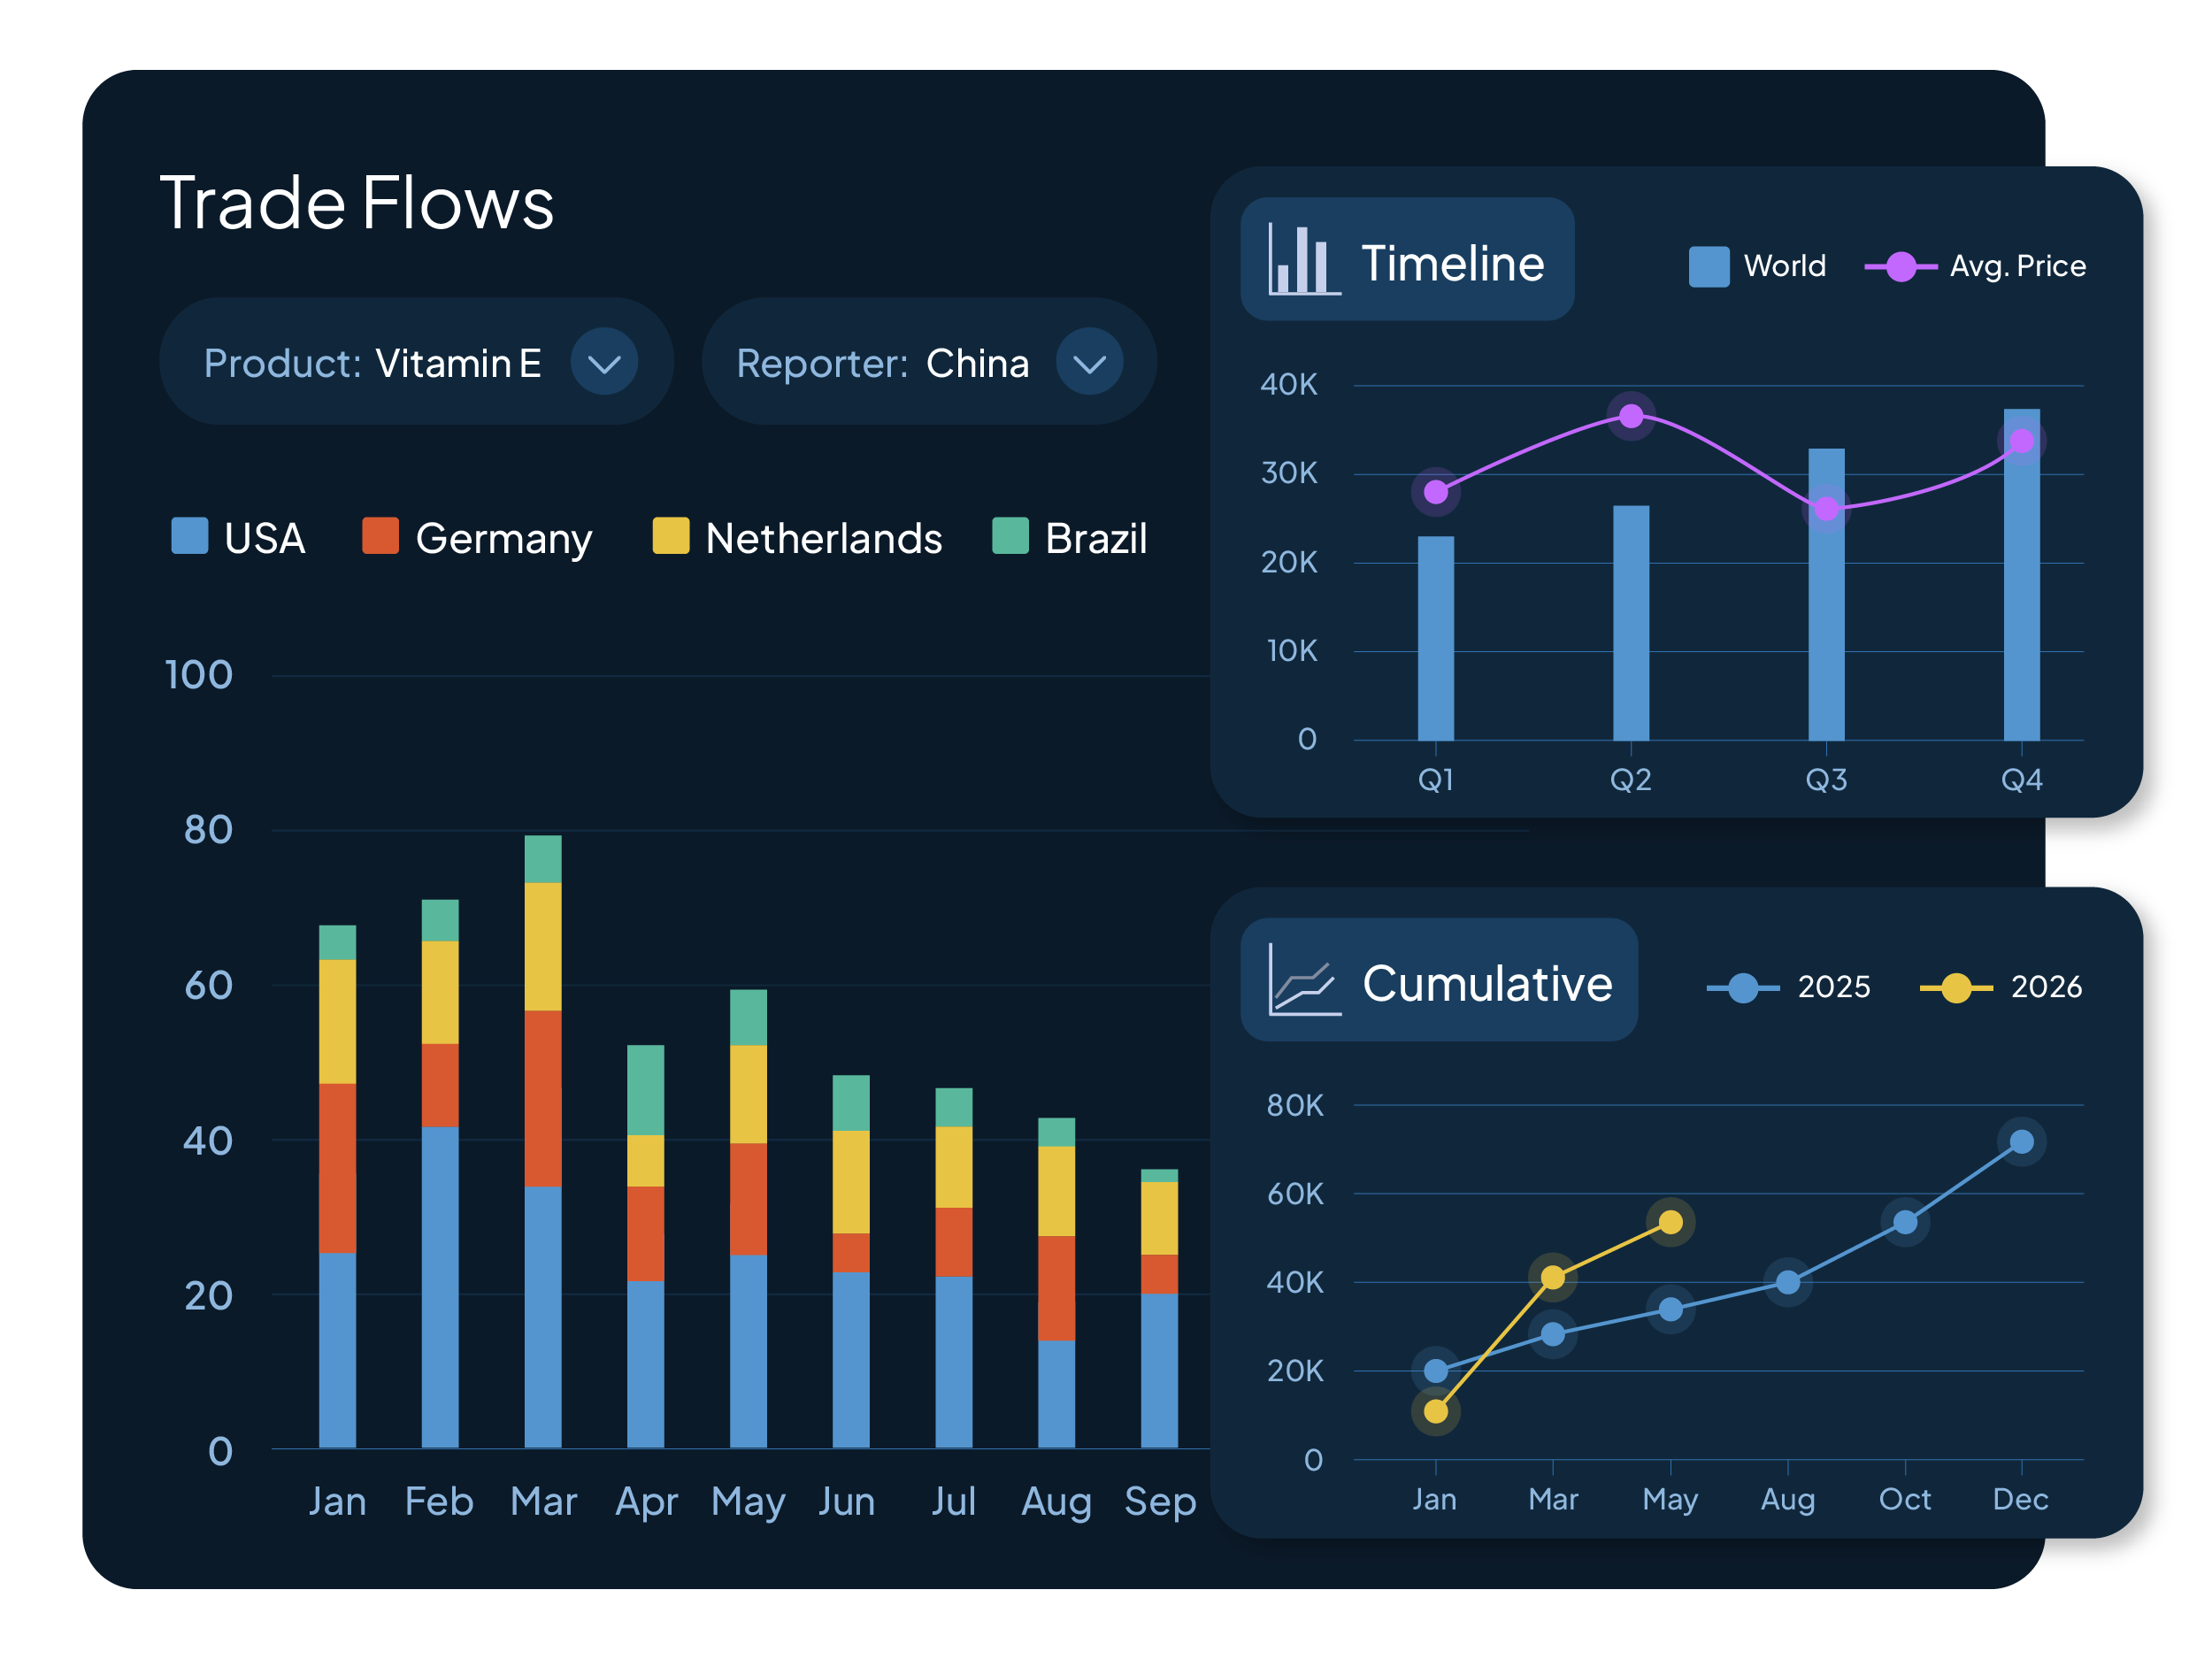
Interactive Trade Visualizations
Switch between different chart views to analyze trade movements from multiple angles:
-
Timeline
-
Seasonal
-
Cumulative
-
Stacked
This allows you to better understand underlying market behavior and how trade patterns evolve over time.
You can also review total trade value alongside average prices to add context on market scale, pricing levels, and changes in trade activity.
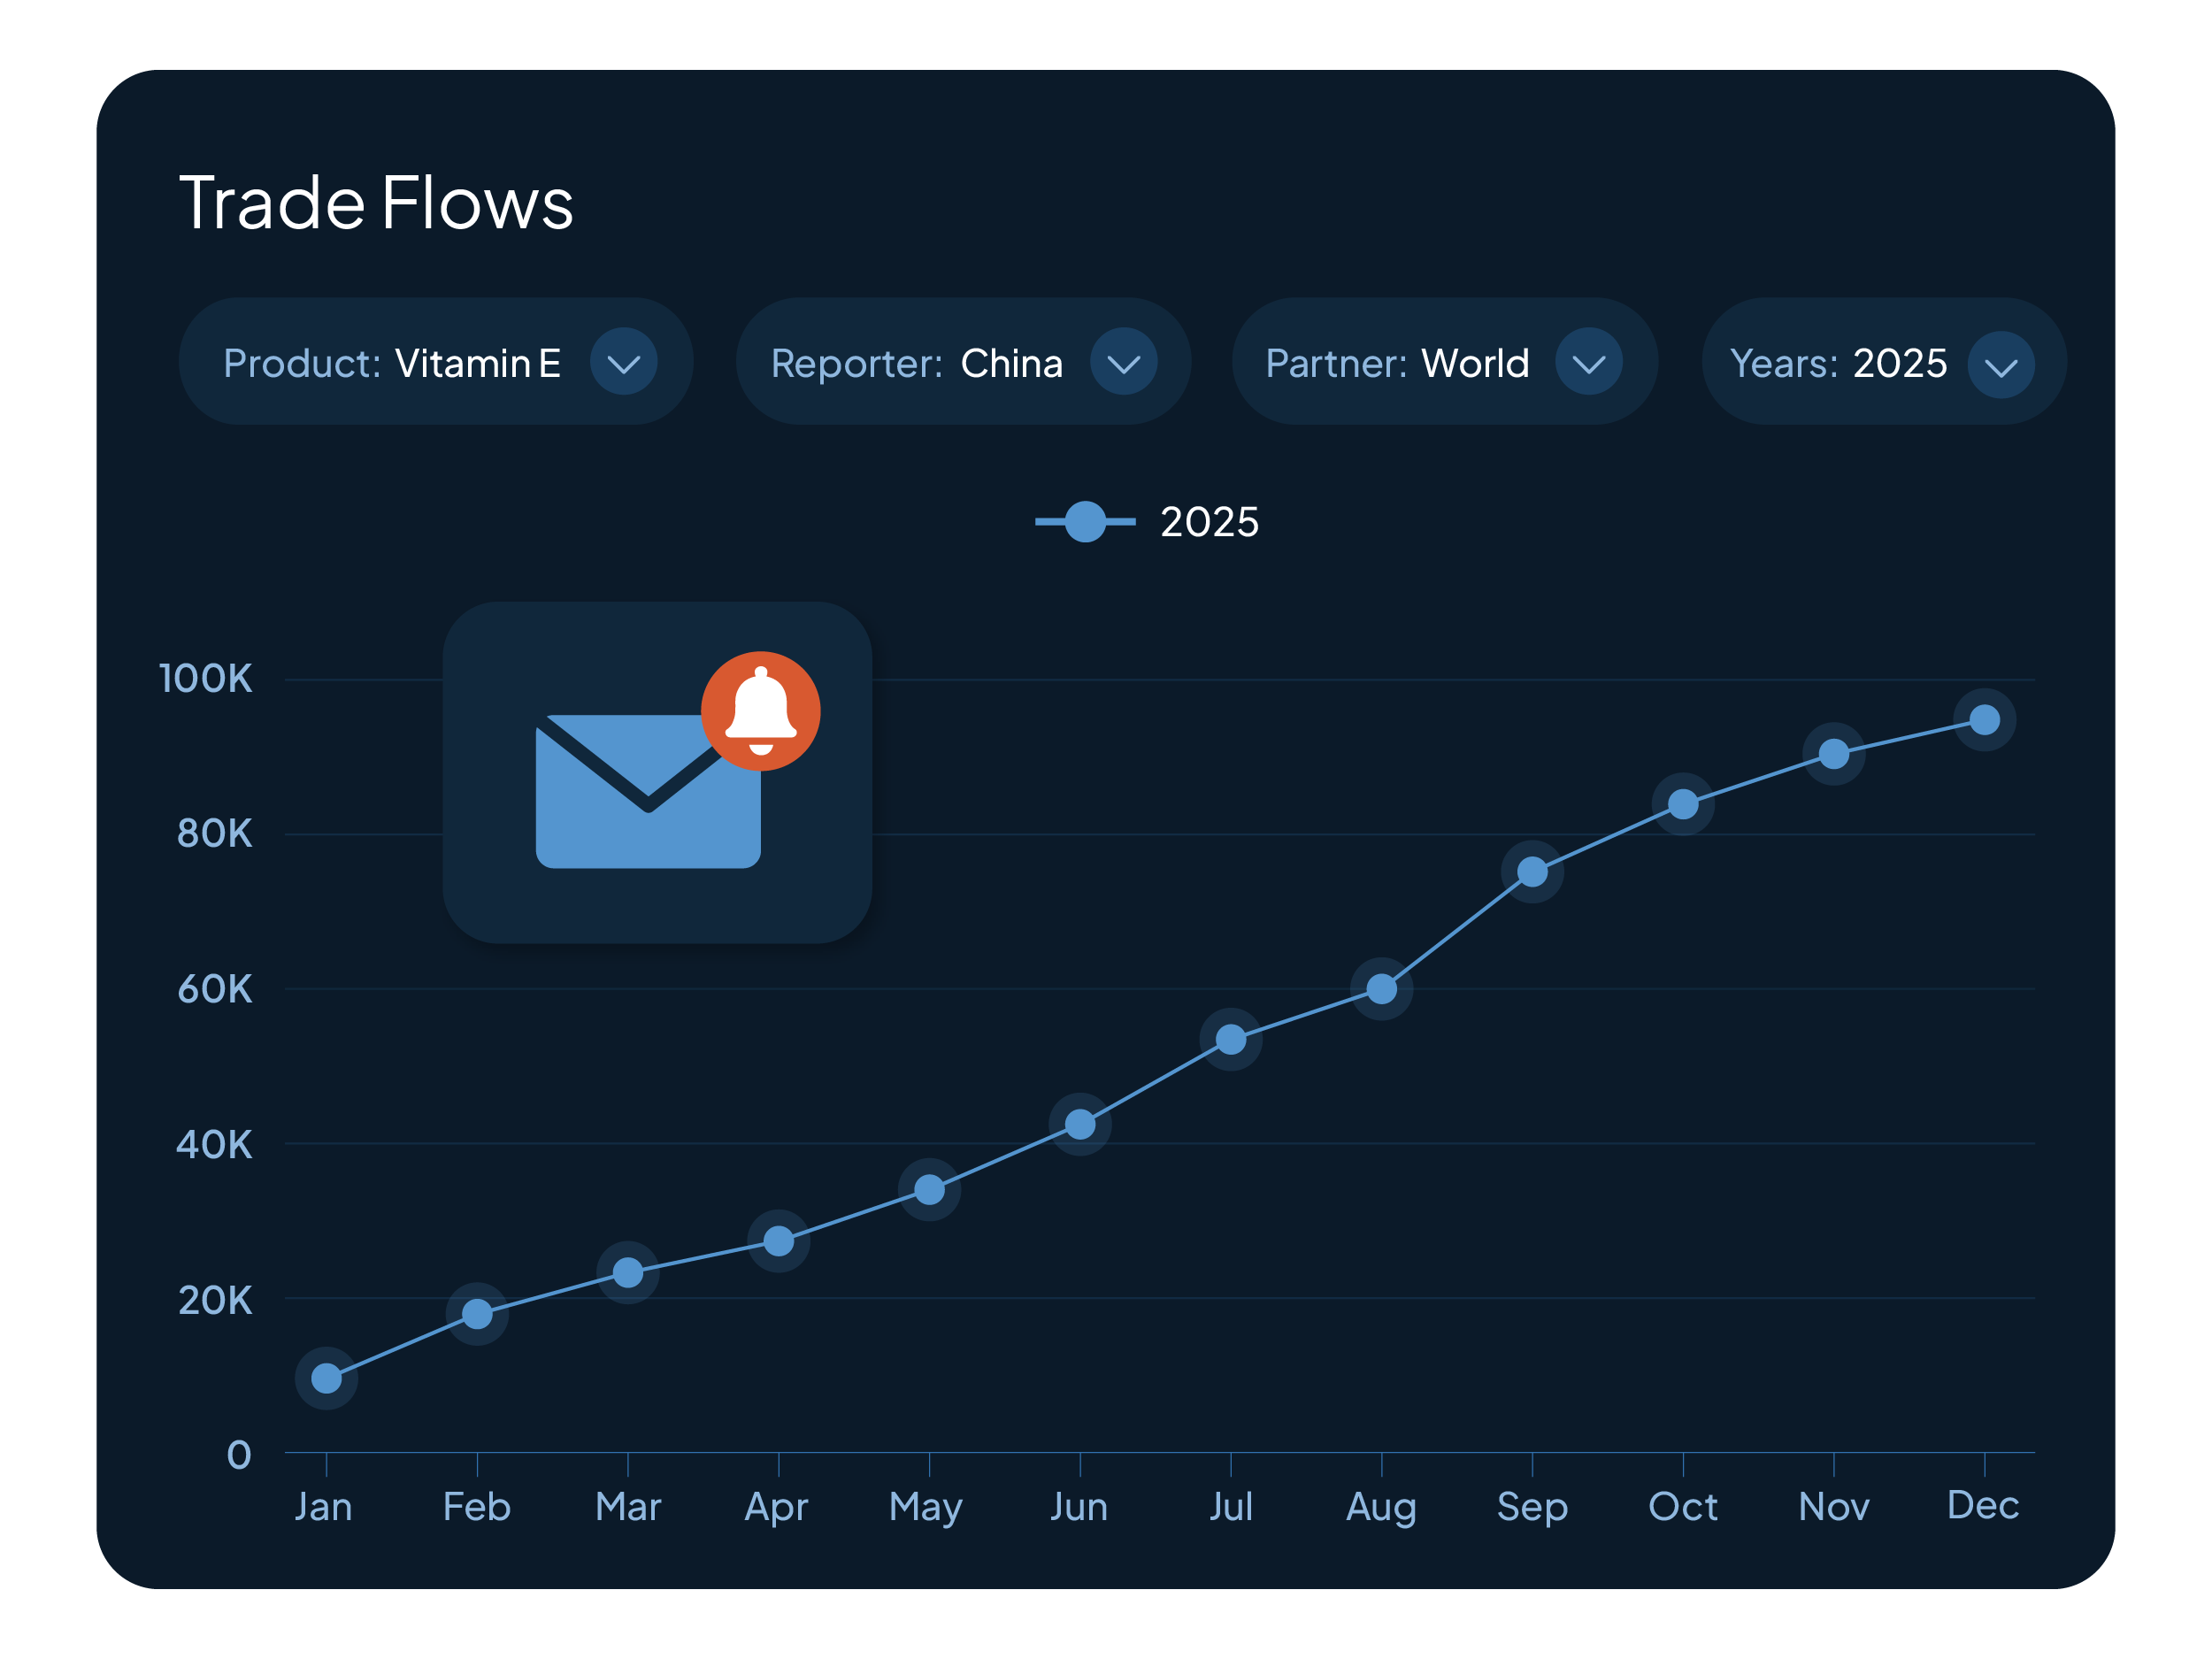
Monthly Updates
Receive a monthly email highlighting key changes in global trade flows for the products you follow.
Each update highlights:
-
Significant shifts in import and export volumes
-
Changes in major supplier or destination markets
-
Emerging trade patterns across regions
- YoY comparisons to understand trend shifts
How Trade Flows Helps You
-
Detect supply shifts earlier
Identify shifts in production or export activity across key regions. -
Identify emerging sourcing markets
Uncover new suppliers, growing exporting countries, and developing markets that may present new sourcing opportunities. -
Understand market concentration
Discover which countries dominate supply and how dependent markets are on specific exporters. -
Track market evolution over time
Understand long-term market dynamics and structural shifts through historical trade data.
What You Get
Monthly Trade Flow Updates
Email alerts highlighting changes in trade flows for your selected products.
Interactive Trade Visualizations
Clear charts to explore volumes, seasonal trends, and cumulative trade flows. Structured import and export datasets covering products, countries, and regions.
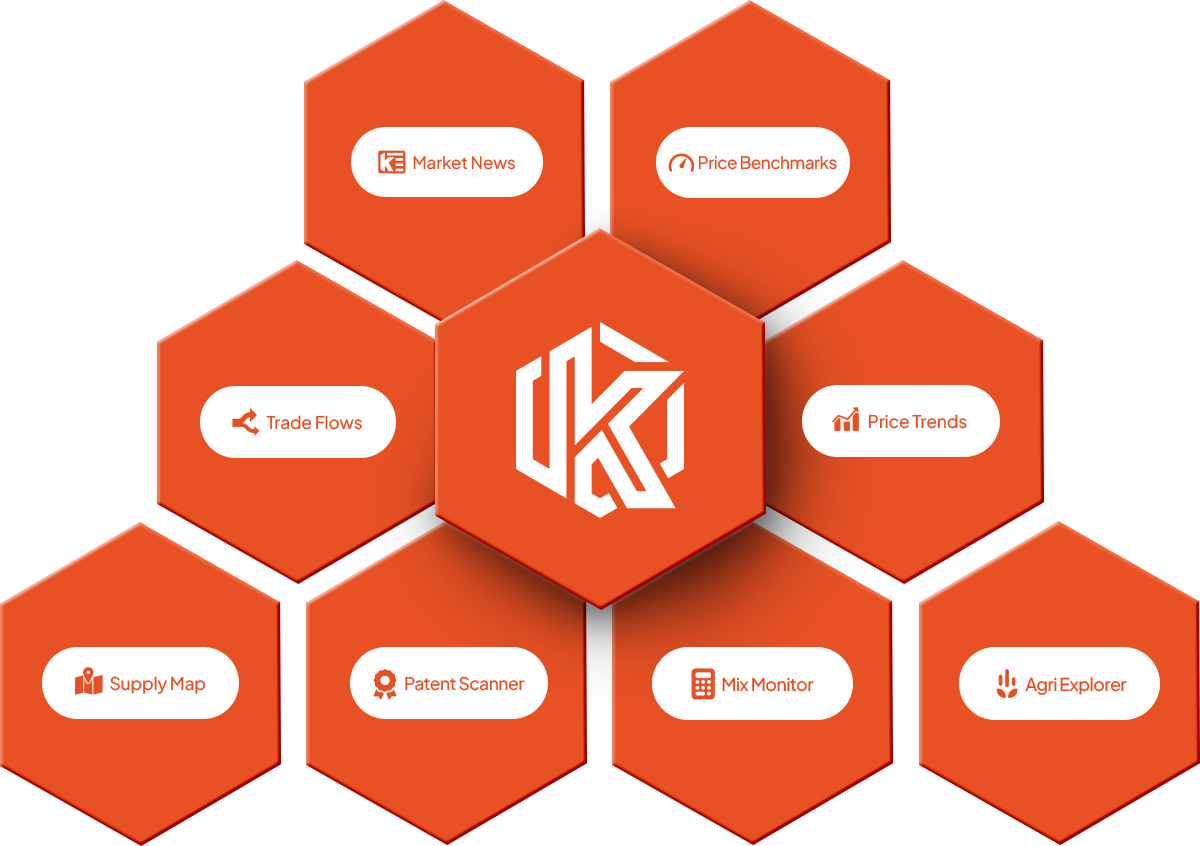
Integrated Within Market Radar
Trade Flows is connected to the broader Market Radar ecosystem.
When you identify a relevant shift in trade activity, you can immediately:
- See prices moving alongside changing trade flows with Price Trends
- Explore producing regions through Agri Explorer
- Identify suppliers and trade routes with Supply Map
- Evaluate cost implications using Mix Monitor
This connection ensures trade movements are interpreted alongside prices, supply origins, market developments, and cost structures, not in isolation.
Providing data-driven insights to 9000+ customers in 95+ countries