
Agri Explorer: Find the Supply Gaps and Surpluses Shaping Agricultural Markets
Agri Explorer helps you analyze global agricultural supply and demand with historical and forecast data.
Why This Matters
A strong harvest, changing consumption patterns, or declining inventories can quickly alter the balance between supply and demand, creating pricing pressure, trade shifts, and new market dynamics.
Without structured access to reliable data, identifying these changes early can be difficult. Analysts and decision-makers often rely on fragmented reports or delayed information, making it harder to assess where supply risks may emerge or where new opportunities may exist.
Agri Explorer brings together historical and forecast data across key agricultural and animal products, allowing you to clearly understand supply and demand dynamics across countries and regions.
How it works
Agri Explorer transforms agricultural supply and demand data into a clear and interactive analysis tool.
1. Agricultural datasets are aggregated and updated
Production, consumption, and stock data across key agricultural and animal products are collected and regularly updated.
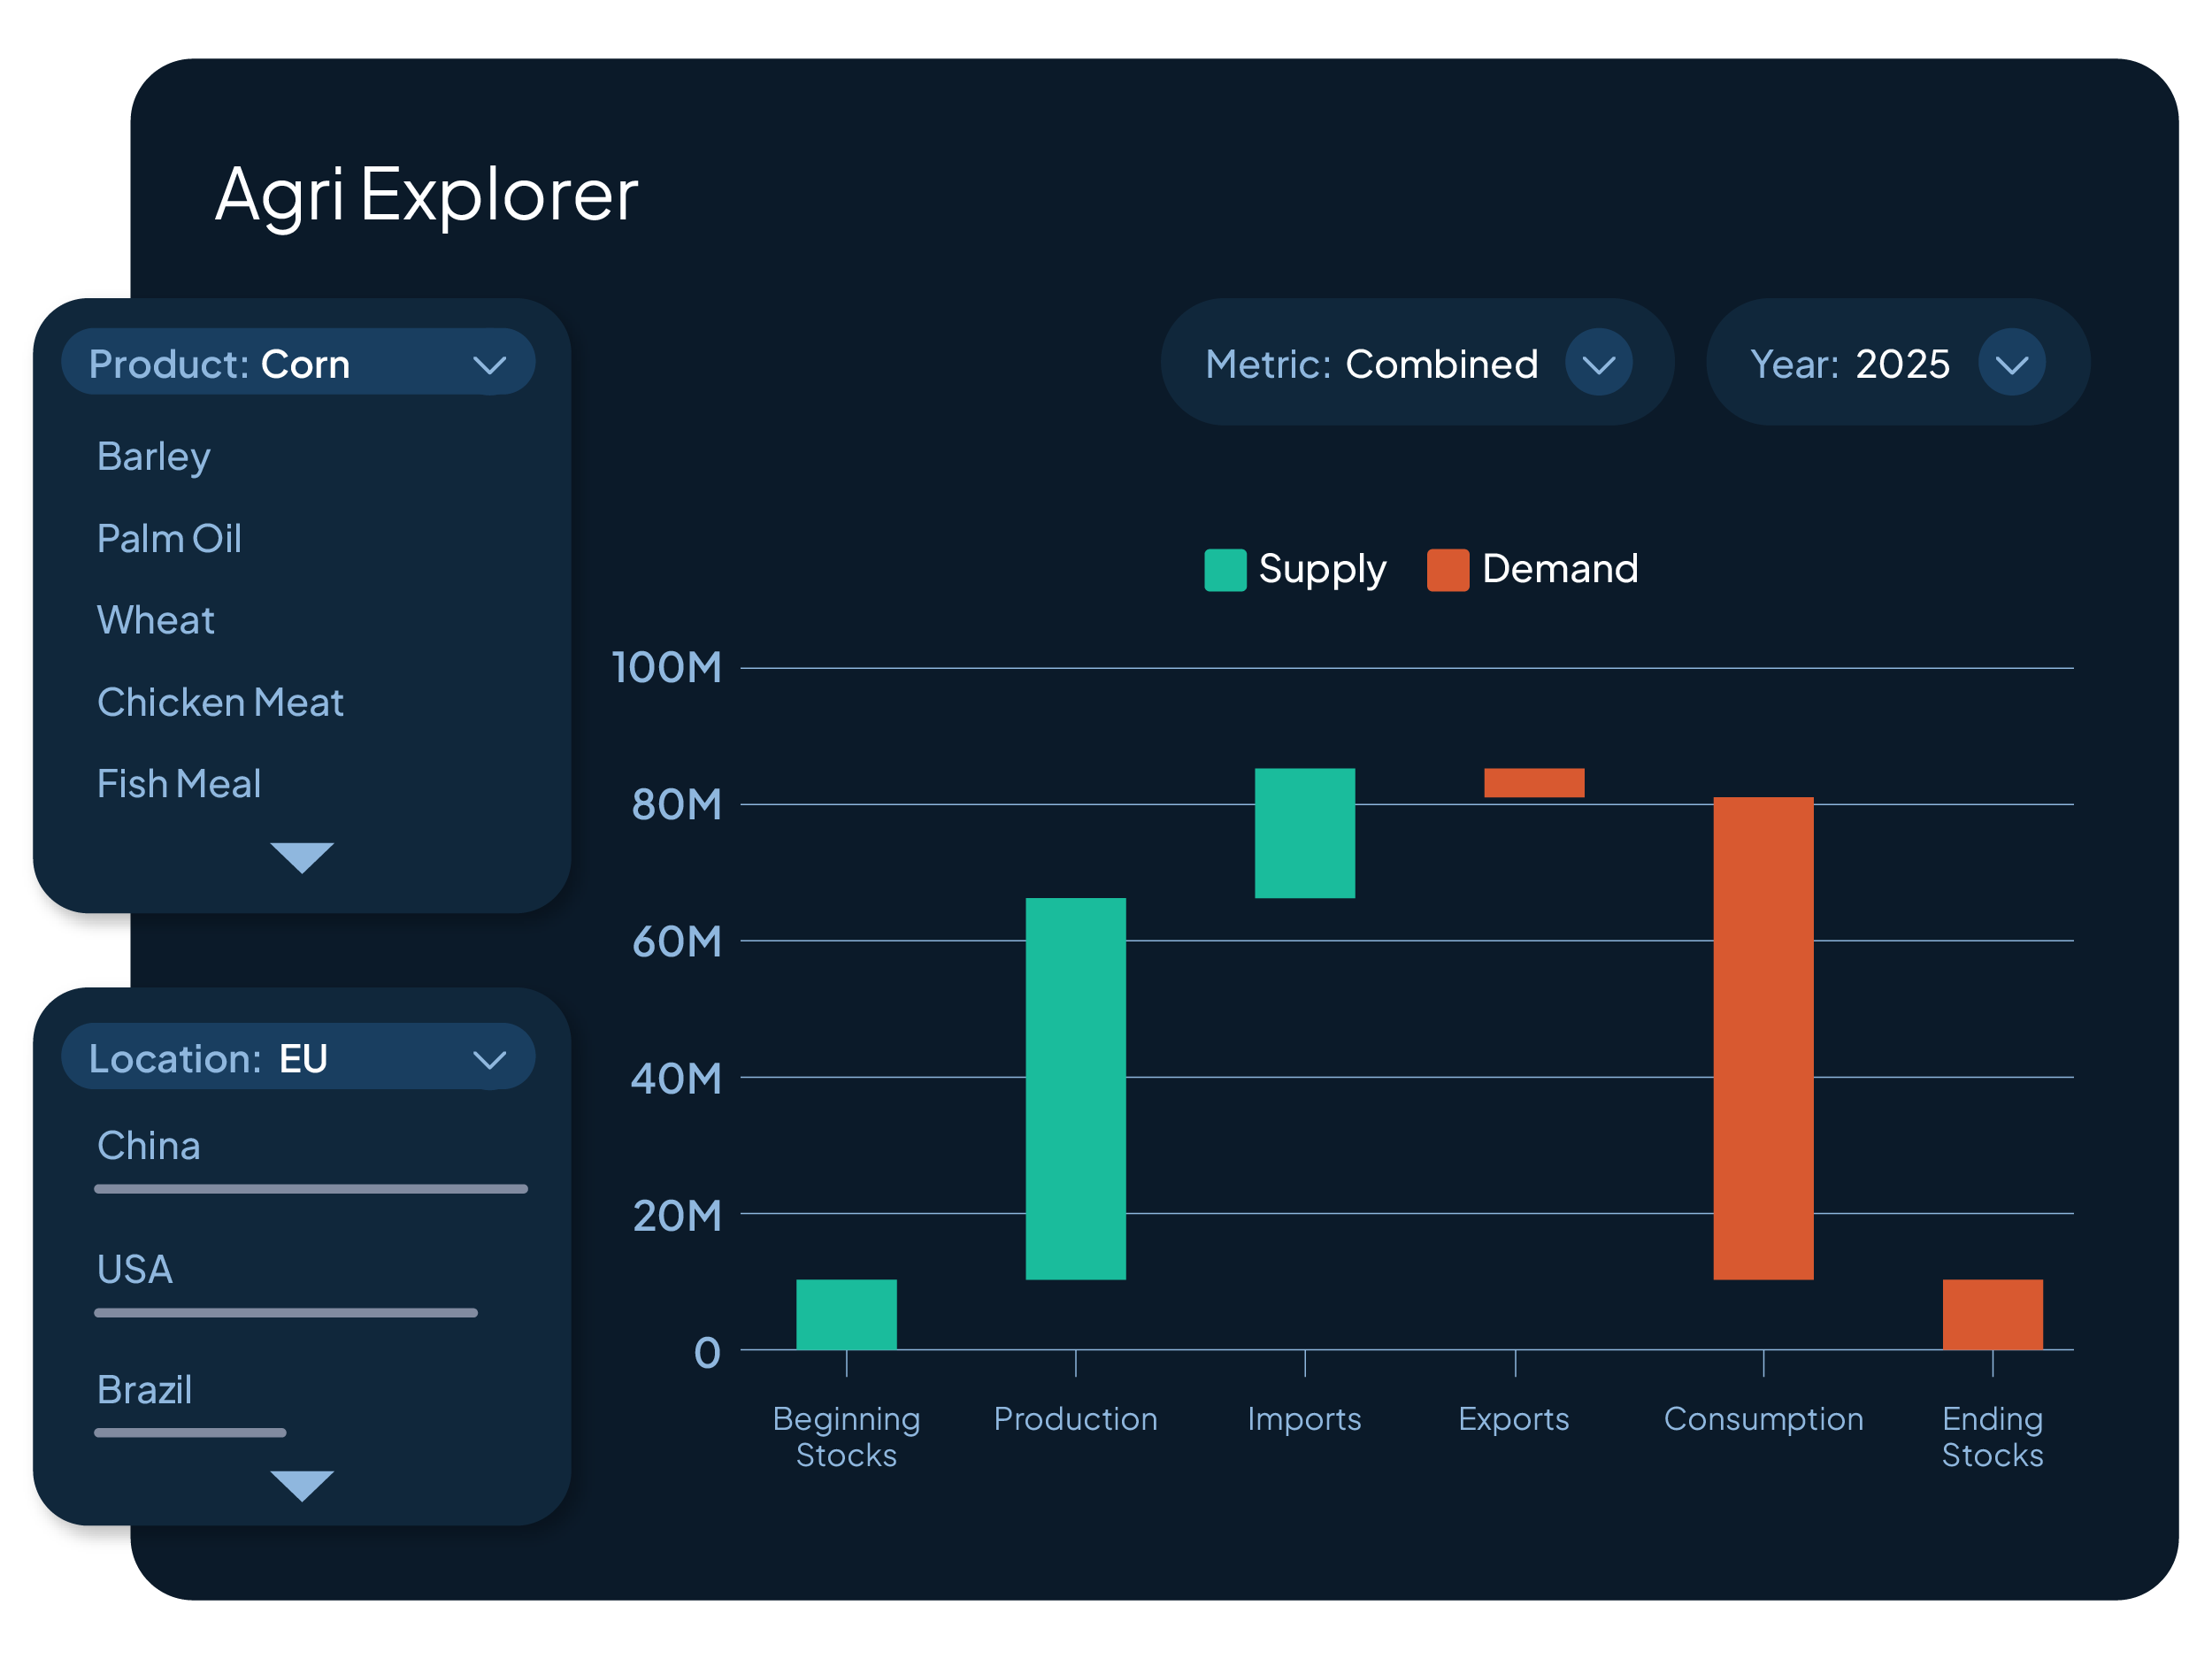
2. Products and indicators can be selected dynamically
Users can explore specific products and analyze metrics such as production, consumption, beginning stocks, or ending stocks.
3. Countries and regions can be compared
Data can be viewed globally, by region, or by individual country to understand geographic supply and demand exposure.
Agricultural Product Coverage
Access supply and demand data for 25+ agricultural and animal products, including “Grains, Oils and seeds”, and Animal Products and Livestock”.
Examples include:
- wheat
- corn
- soybean meal and soybean oil
- palm oil
- fish meal
- meat (beef and veal, chicken, swine)
- milk (dry and liquid)
- and many others
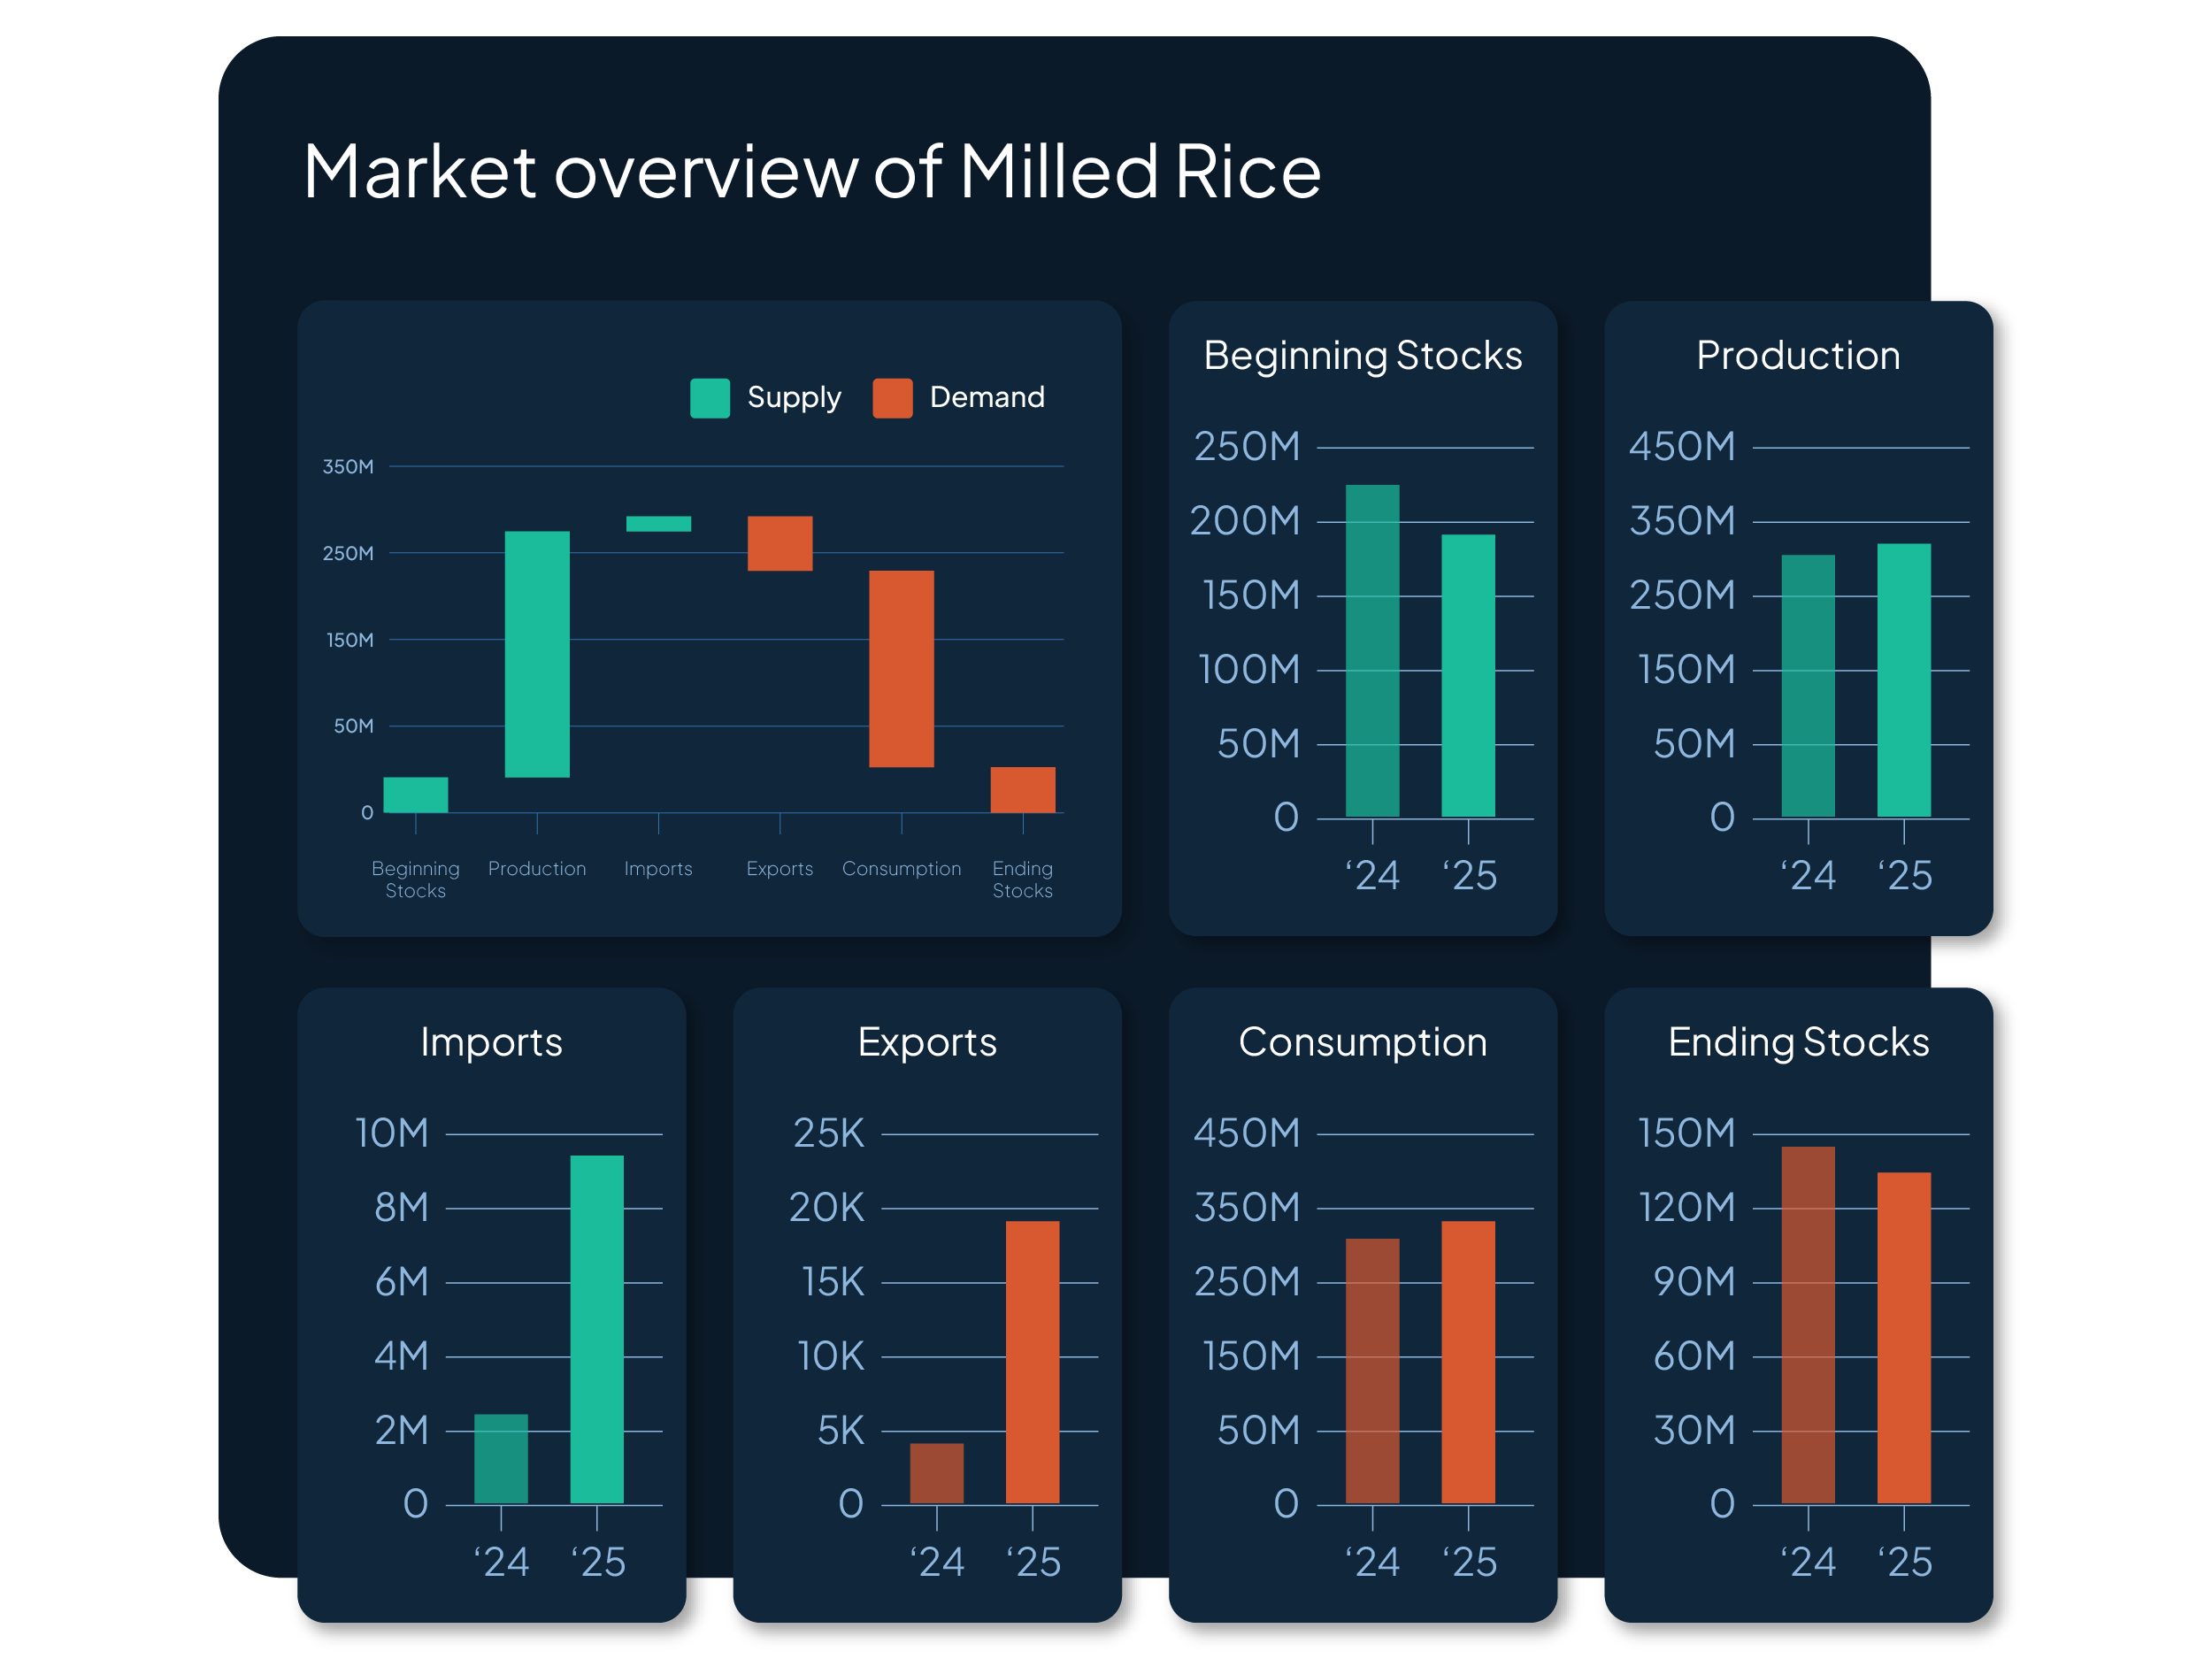
Supply & Demand Indicators
Analyze key agricultural indicators that shape market fundamentals, including:
-
Production
-
Consumption
-
Beginning stocks
-
Ending stocks
- Combined
These metrics provide a structured view of how supply and demand evolve across markets.
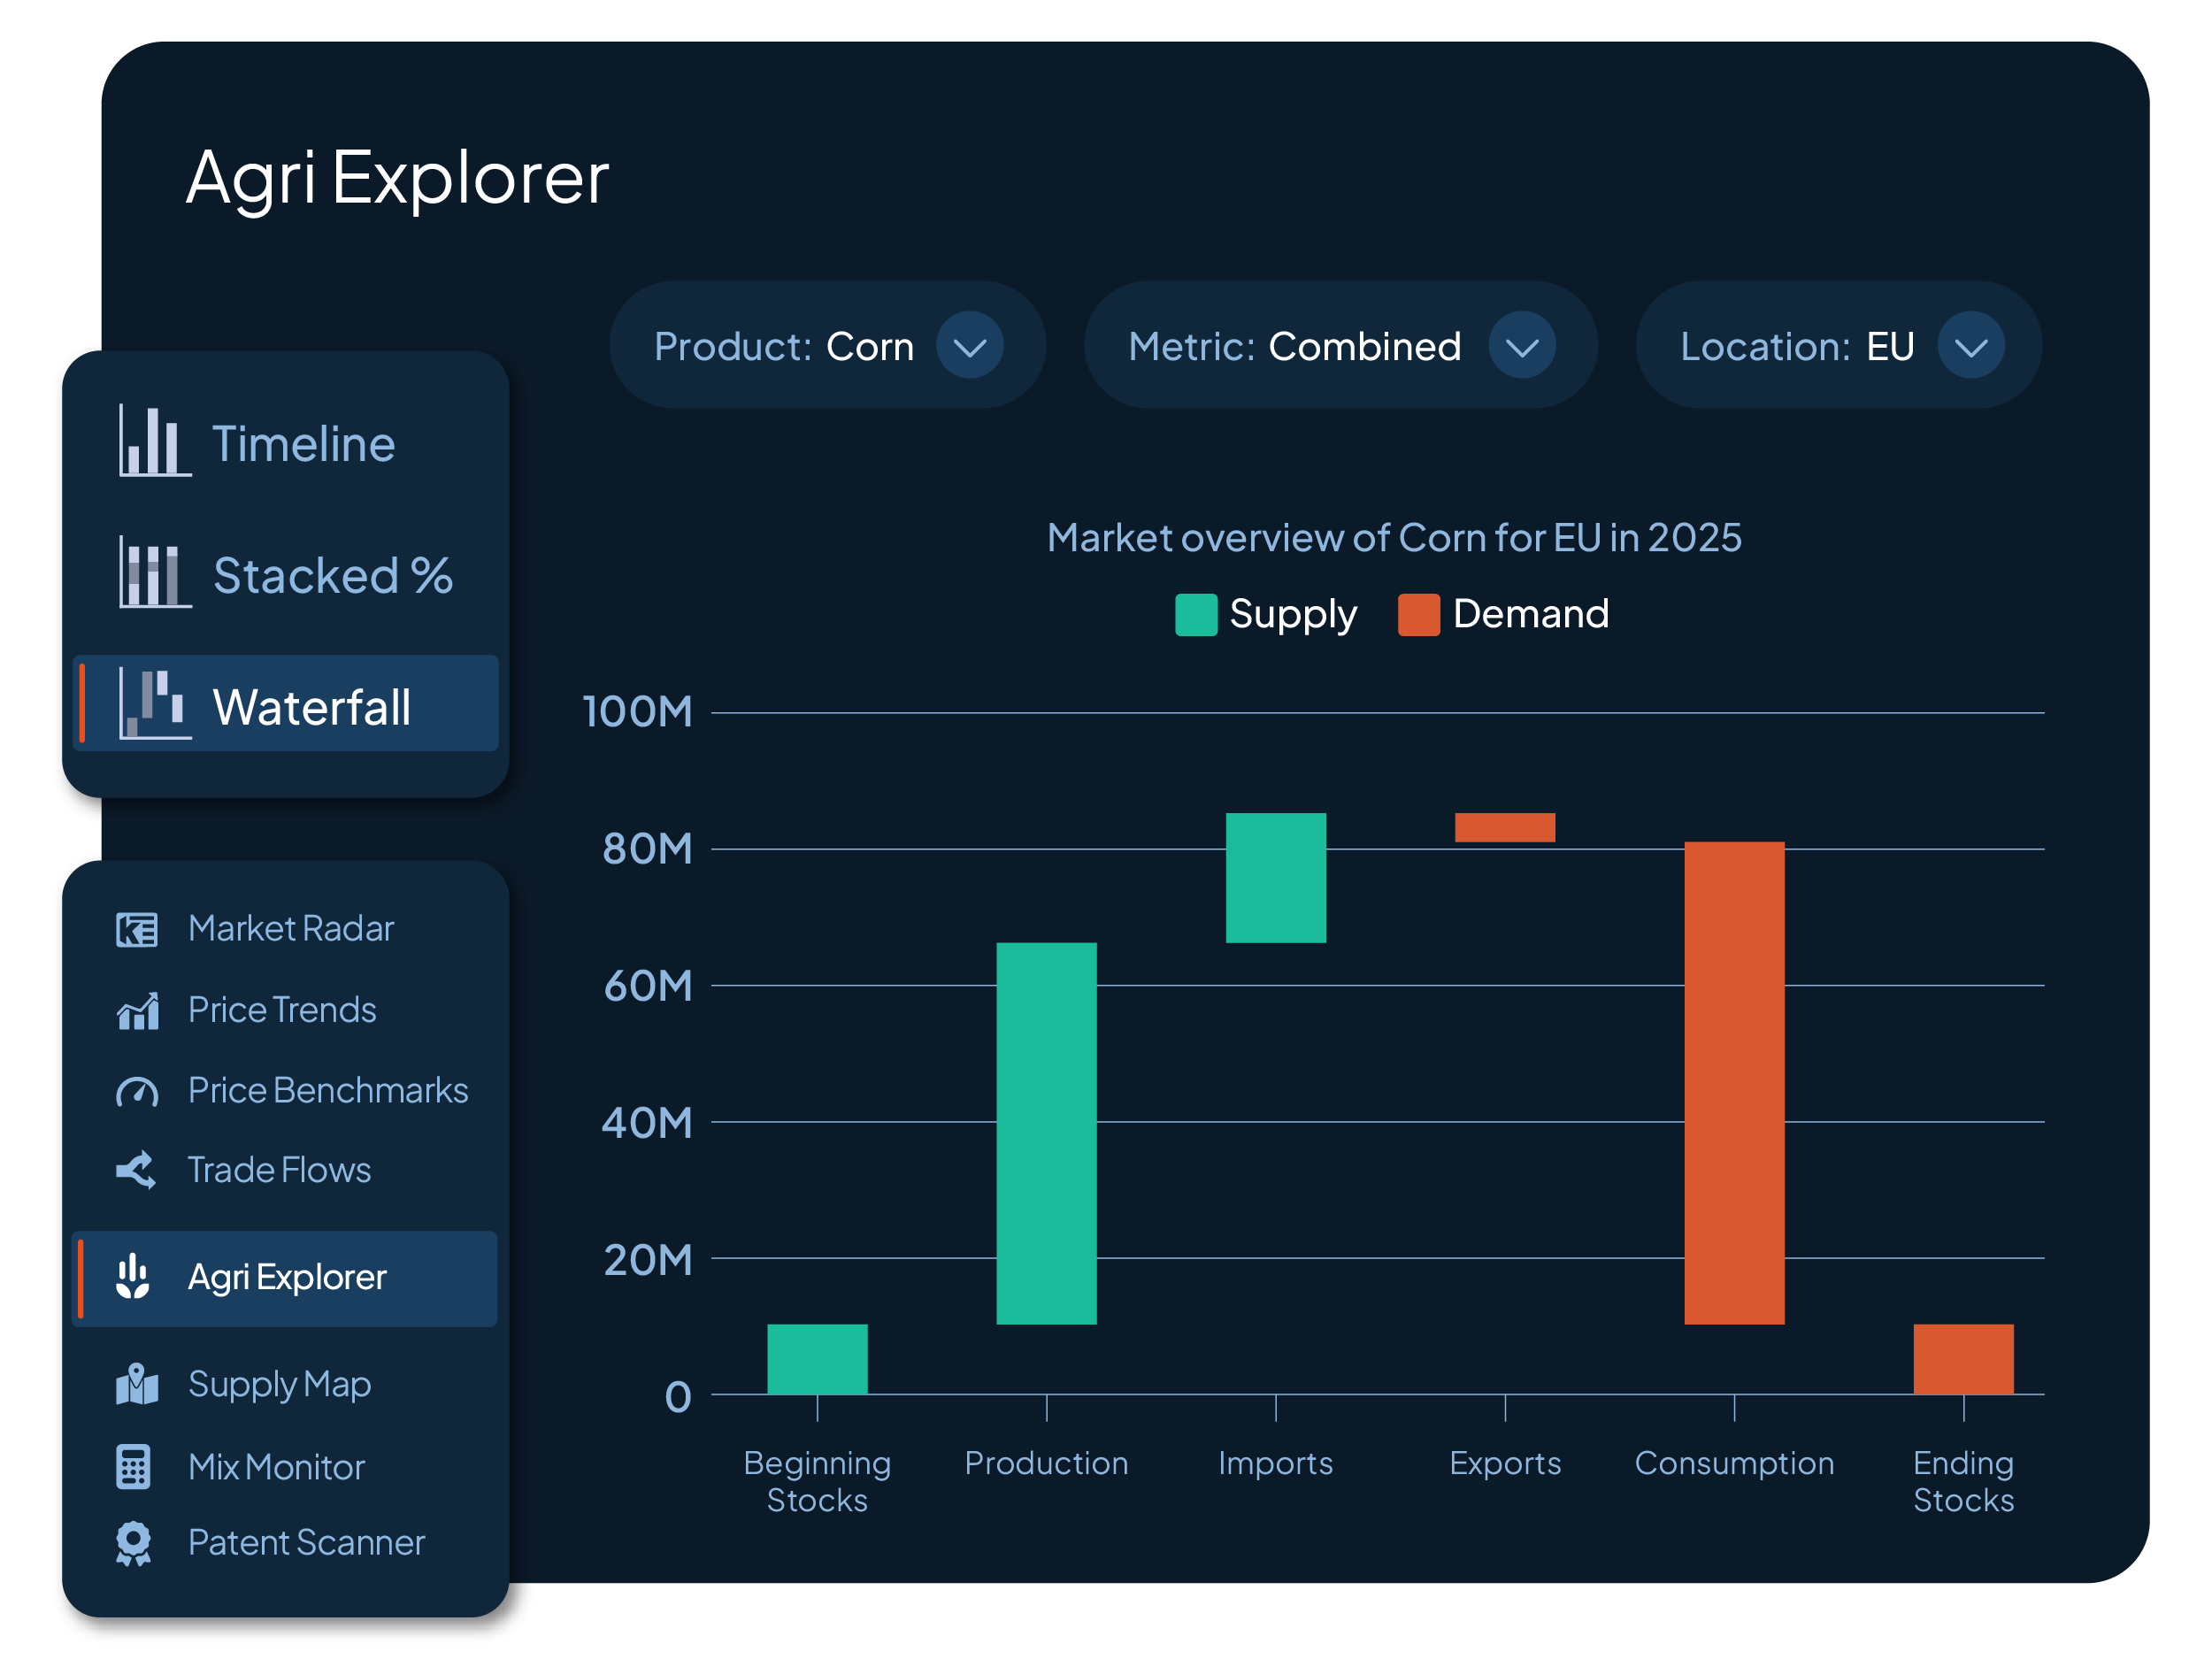
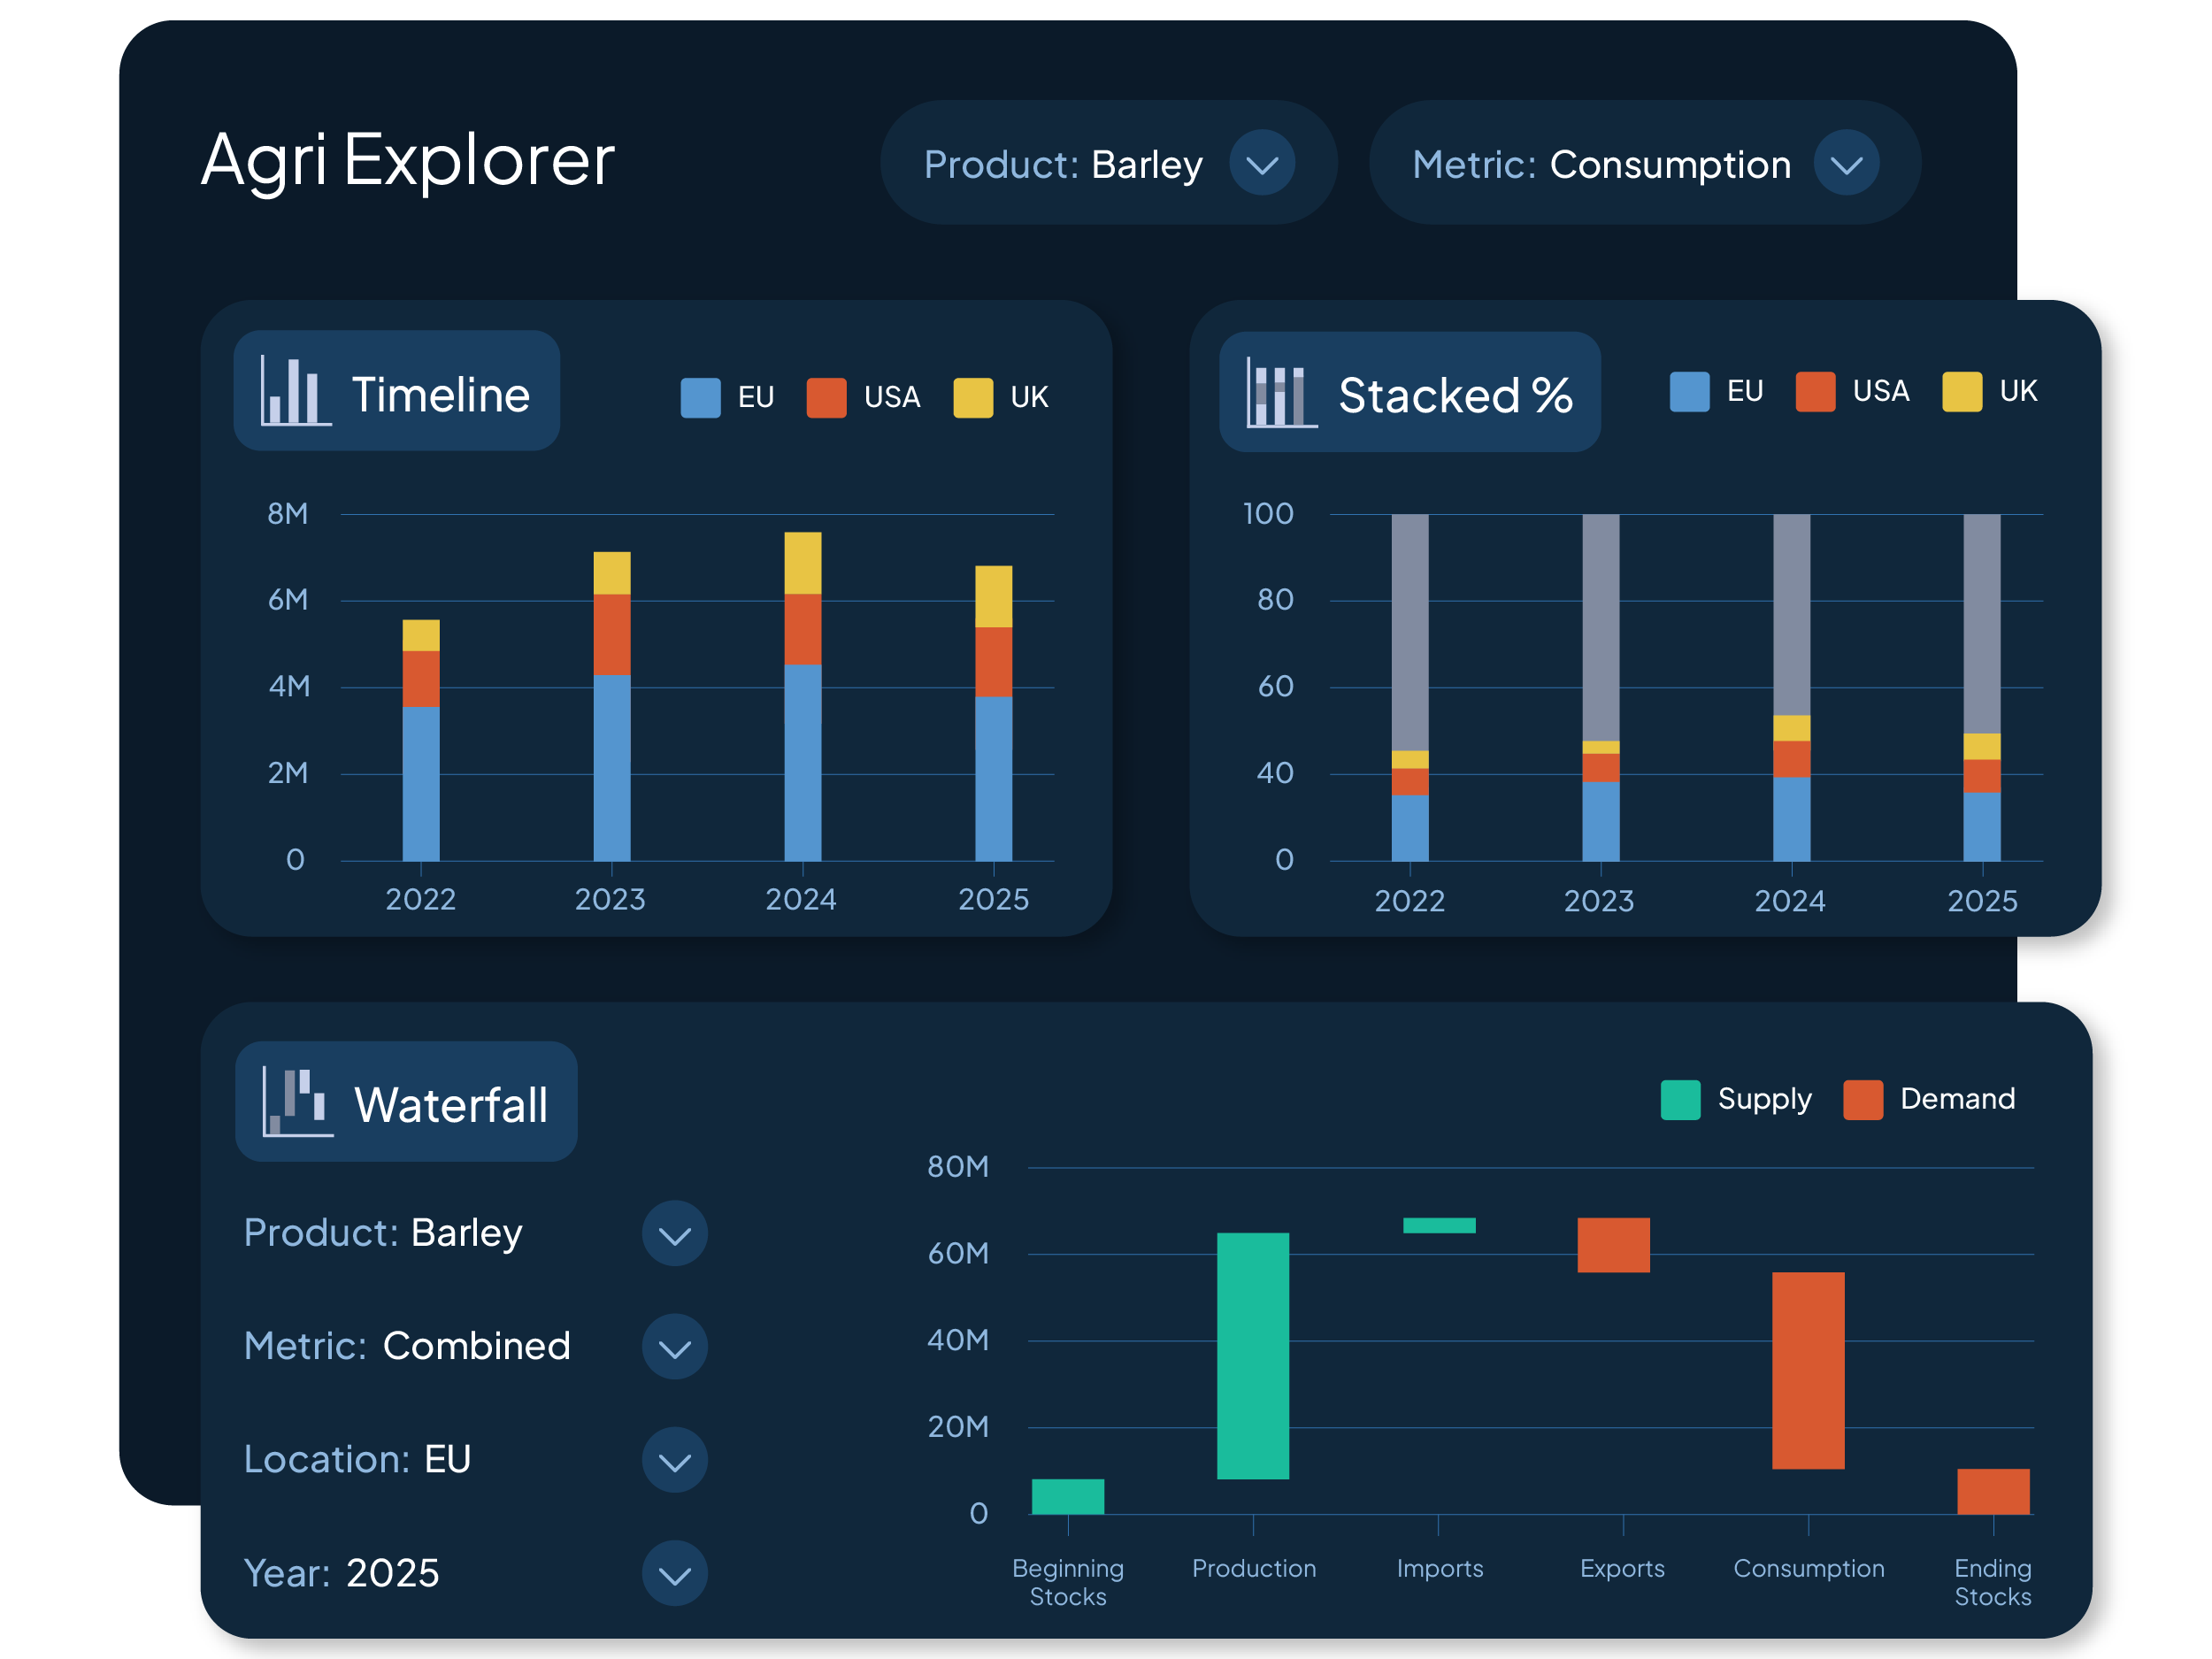
Multiple Data Visualization Modes
Explore agricultural supply and demand data through several visualization formats designed to highlight market dynamics across countries, regions, or global aggregates.
-
Timeline view to track long-term trends
-
Stacked view to compare regional or country-level contributions
-
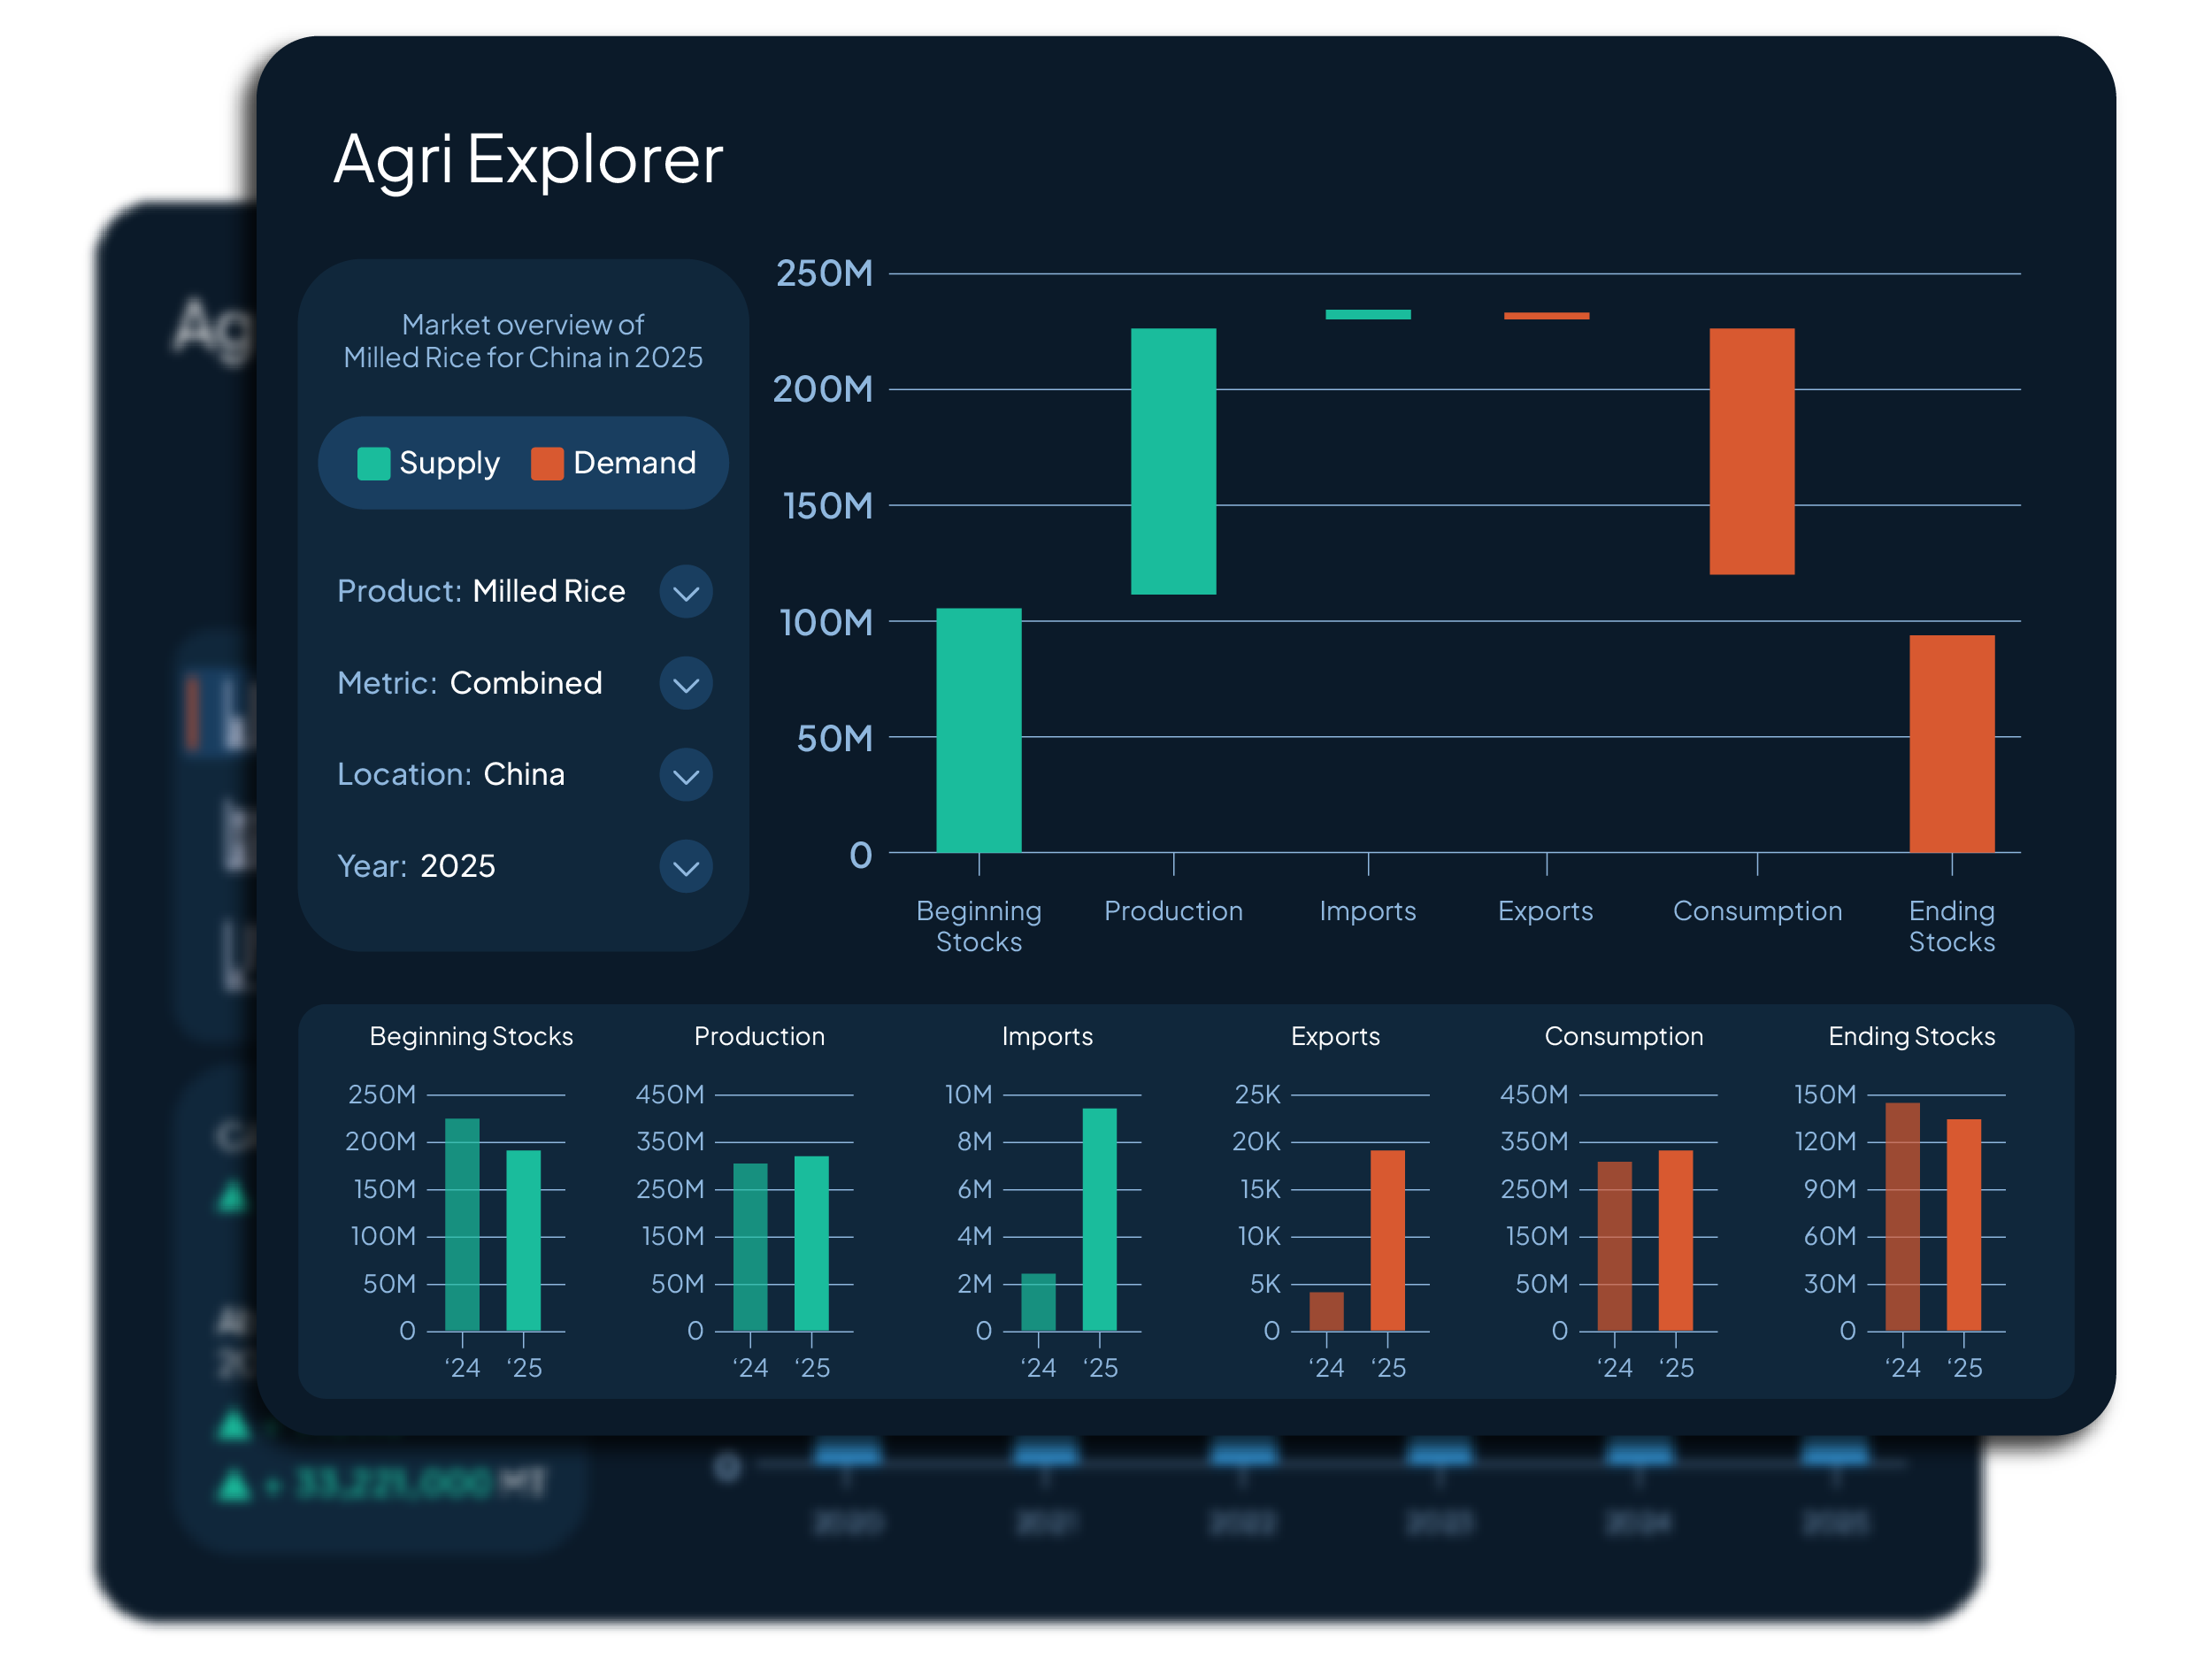
Waterfall view to analyze supply-demand balances
These visualizations help transform complex datasets into clear insights while making it easy to compare how supply and demand evolve across different markets.
How Agri Explorer Helps You
-
Understand global supply and demand dynamics
Track how production, consumption, and stock levels evolve across key agricultural markets. -
Identify supply shortages and surpluses
Compare production and demand across regions to detect imbalances that may influence pricing. -
Discover new market opportunities
Identify regions where demand exceeds supply, revealing potential opportunities for new market entry. -
Avoid oversupplied markets
Recognize regions where production significantly exceeds demand and avoid entering saturated markets.
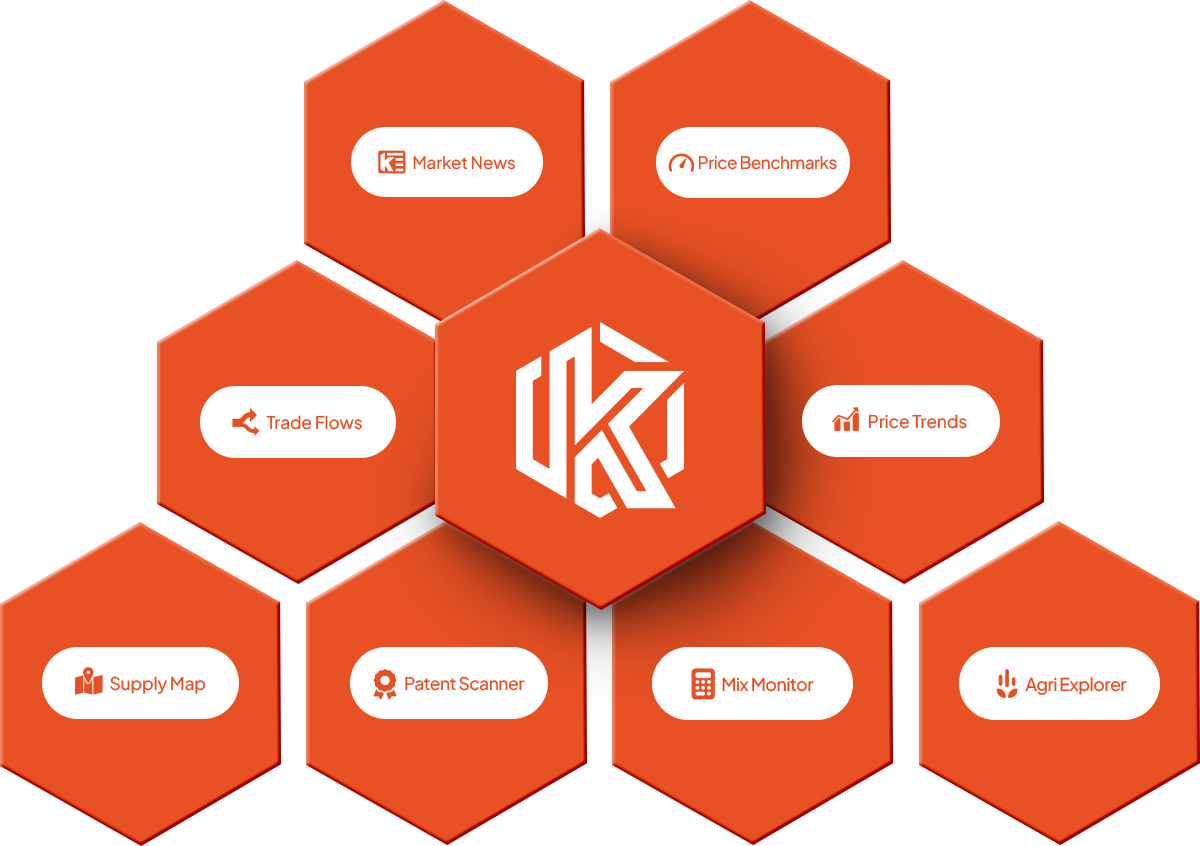
Integrated Within Market Radar
Agri Explorer is connected to the broader Market Radar ecosystem.
When analyzing agricultural supply and demand dynamics, you can immediately:
- Review commodity price movements through Price Trends
- Understand global trade movements through Trade Flows
- Identify manufacturers through Supply Map
- Evaluate formulation cost impact using Mix Monitor
This connection ensures agricultural market fundamentals are analyzed alongside pricing trends, trade flows, supplier intelligence, and formulation cost dynamics.
Providing data-driven insights to 9000+ customers in 95+ countries