Key Takeaways
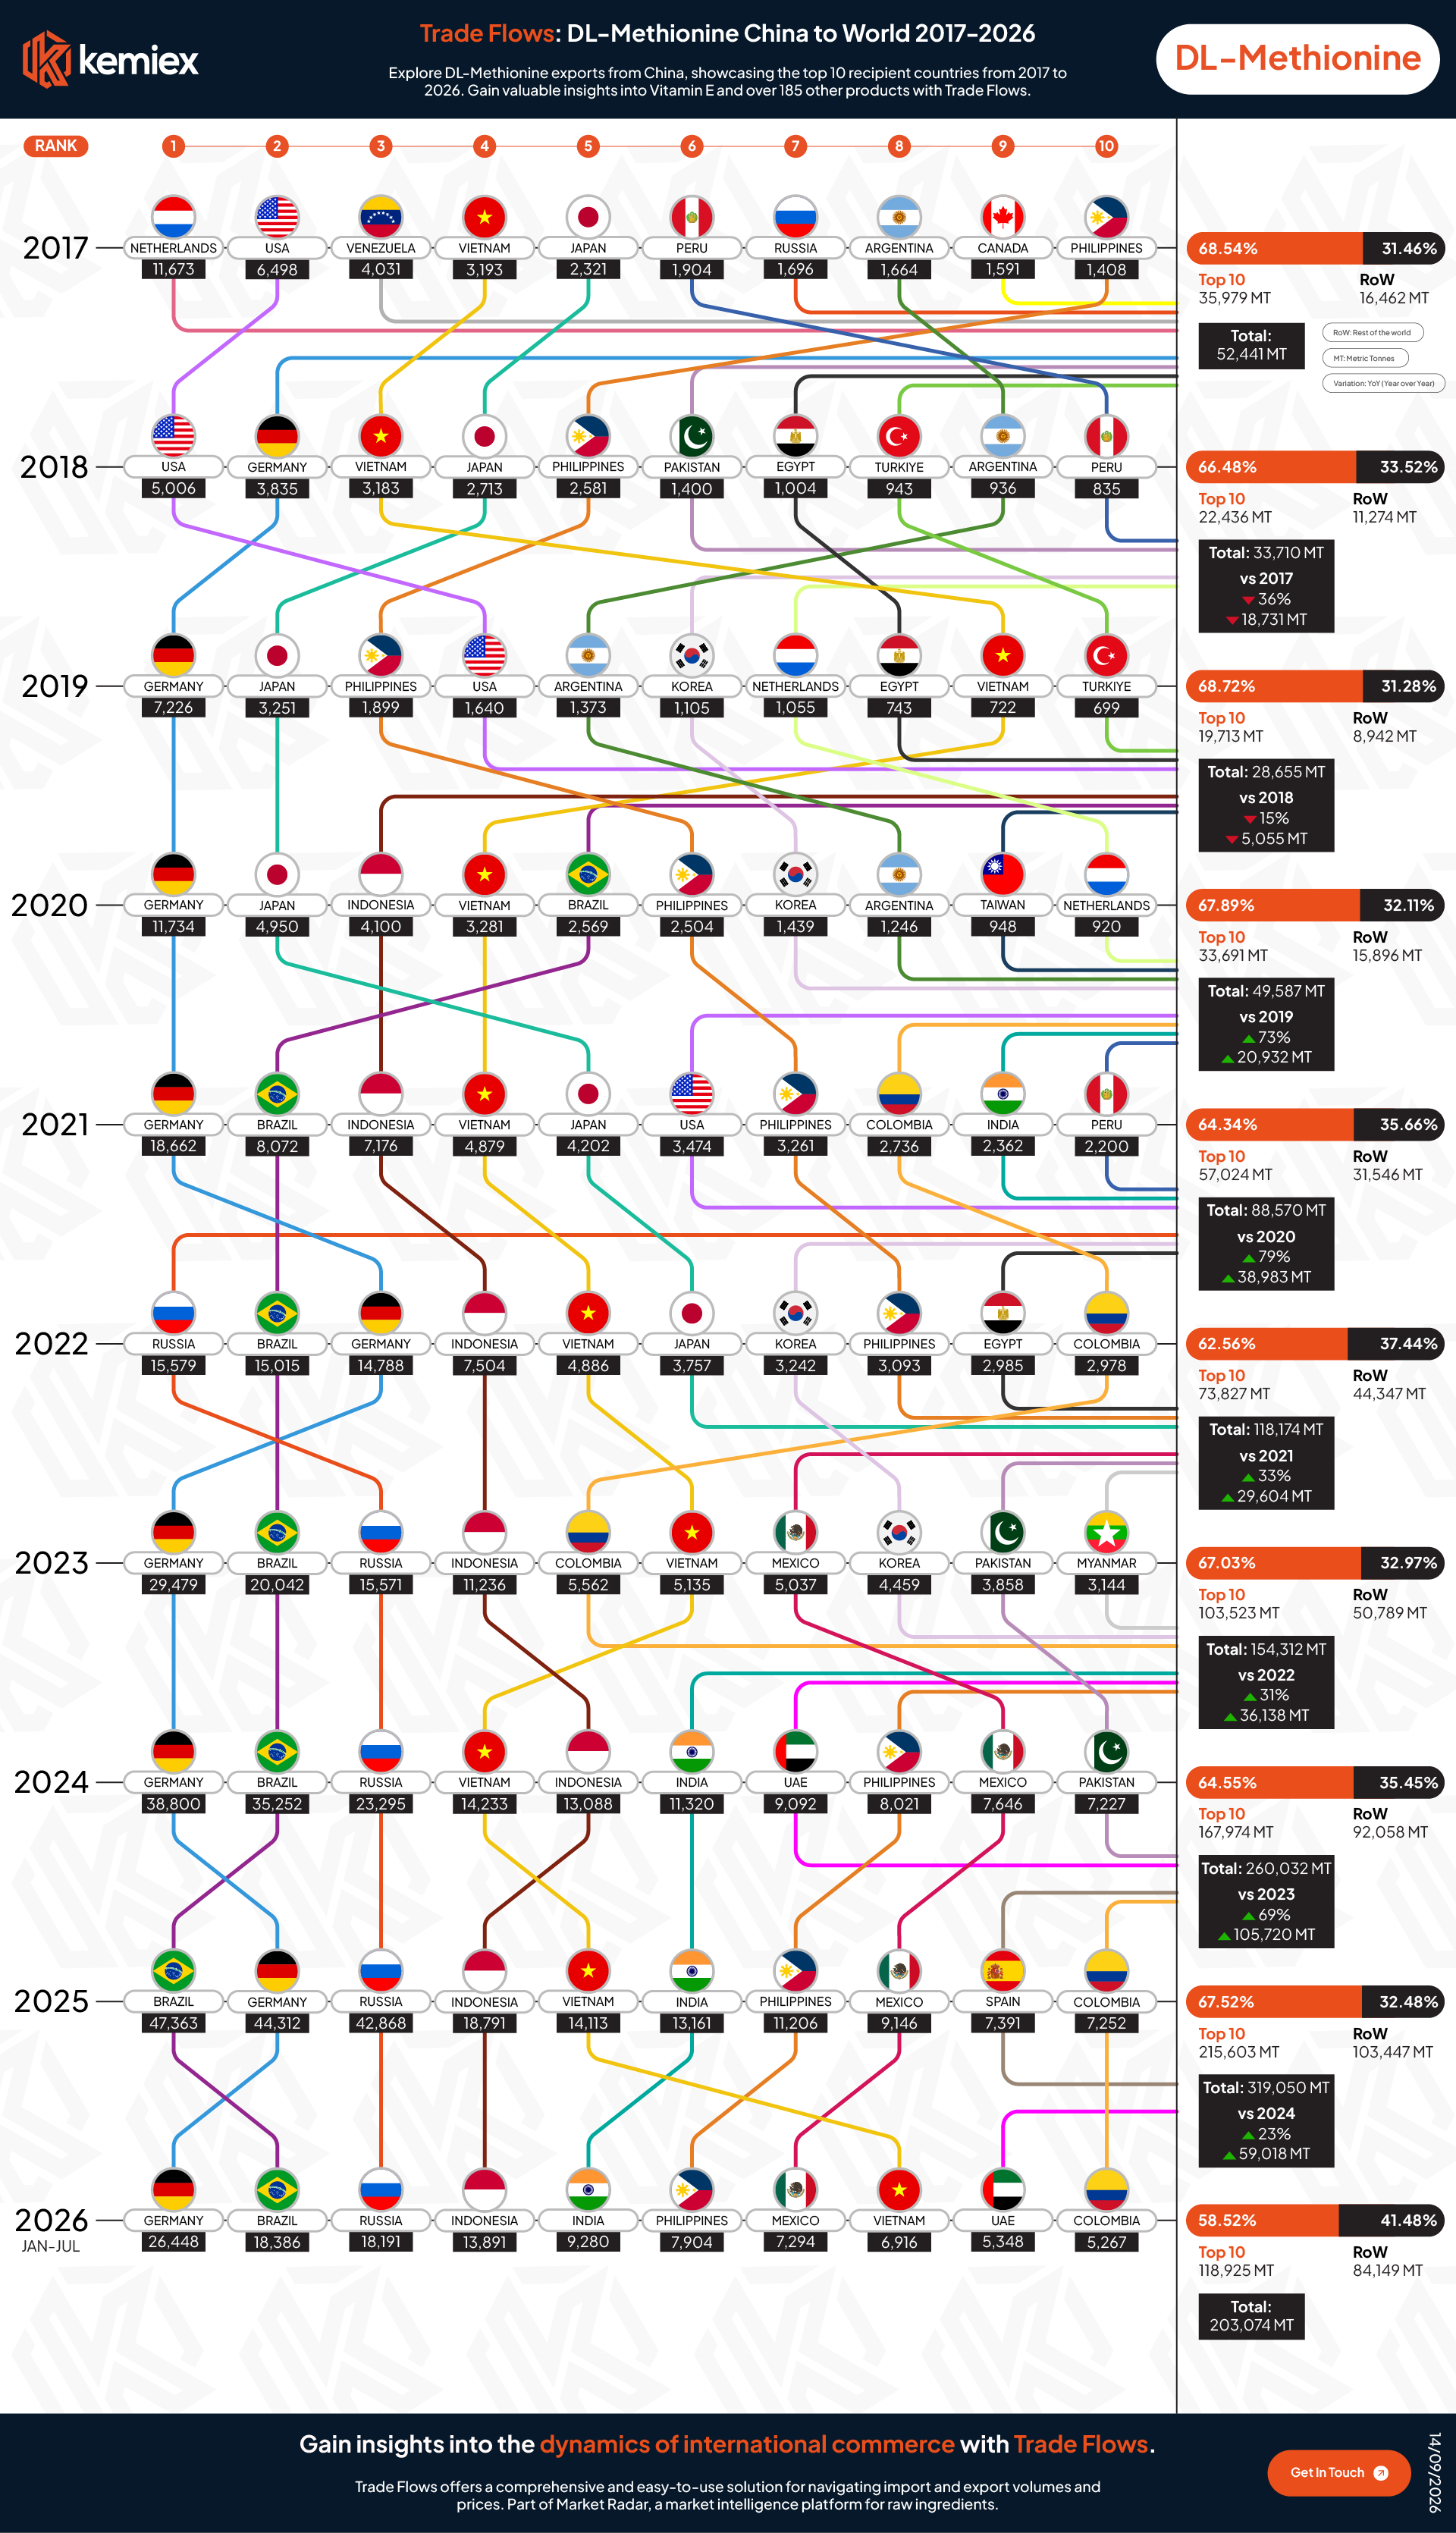
- In the first seven months of 2026, the top 10 destinations for Chinese DL-Methionine took 58.6% of total exports, the lowest share recorded anywhere in the 2017 to 2026 series, which had otherwise stayed between 62% and 69% every year.
- Rest of world volumes, meaning everything outside the top 10, reached 84,149 MT in those seven months alone, more than the full-year total for every year from 2017 through 2023.
- Spain, which entered the top 10 for the first time in 2025 at 7,391 MT, has already dropped back out in the first seven months of 2026, replaced by the UAE, one sign of how much movement there now is below the top few positions.
China’s DL-Methionine exports are reaching a wider set of buyers than at any point since 2017. In the first seven months of 2026, the top 10 destination countries accounted for 58.6% of total exports, down from 67.6% for all of 2025 and lower than any full year on record.
The shift shows up on both sides of the ledger: rest of world volumes reached 84,149 MT in those seven months, already ahead of the full-year rest of world total for every year from 2017 through 2023.
Figures are drawn from Kemiex trade flows and cover Chinese DL-Methionine exports from 2017 to June 2026, with 2026 representing January to June only.
The Top 10 Share of China DL-Methionine Exports Stayed in a Narrow Band Until Now
From 2017 through 2025, the top 10 destinations took between 62.5% and 68.8% of total Chinese DL-Methionine exports in every single year, a nine-year band just six percentage points wide.
The first seven months of 2026 broke that pattern outright, dropping to 58.6%, more than three points below the previous low.
Rest of World Volumes Are Growing Faster Than Top 10 Volumes
Comparing average monthly volumes makes the shift clearer than the year-end totals alone.
Top 10 volumes averaged 17,967 MT a month across all of 2025, and are averaging 16,989 MT a month across the first seven months of 2026, a pace roughly 5% slower.
Rest of world volumes, by contrast, averaged 8,621 MT a month in 2025 and are averaging 12,021 MT a month so far in 2026, a pace roughly 39% faster.
Put simply, growth this year is concentrated outside the established top 10 rather than within it.
Twenty-Four Countries Have Made the Top 10 Since 2017
Across the ten annual rankings from 2017 through July 2026, 24 different countries have appeared among China’s top 10 DL-Methionine destinations at least once.
Only Germany and Vietnam have appeared in every year since their respective debuts (Vietnam since 2017, Germany since 2018), while more than a third of the countries that have ever made the list appeared in a single year and never returned, including Venezuela, Canada, Taiwan, and Myanmar.
About This Data
These figures come from Trade flows which covers import and export volumes and prices for more than 185 raw ingredients, including vitamins, amino acids, minerals and feed additives, with country level detail on origins and destinations. It sits within market radar alongside price benchmarks and market news.
If you want the full destination list behind these totals, including the markets sitting outside the top 10, or any of the other ingredients we cover, get in touch with our team.