Price Benchmarks: The Full Price Picture, Not Just a Quote You Received
Discover weekly min/max/avg price ranges across 30+ amino acids, vitamins, minerals, and feed additives.
Why This Matters
Procurement teams don’t always see the full picture behind market prices.
Supplier quotes show only a portion of the market, while traditional reports rely on simple averages that hide how prices are actually distributed.
Without reliable benchmarks, it becomes difficult to judge whether a quote is competitive, understand price movements, or identify favorable negotiation opportunities.
Price Benchmarks provides structured visibility into real market price ranges, helping procurement teams approach negotiations with greater clarity.
How it works
Price Benchmarks are built from real market data reported by industry participants who contribute every week.
1. Market Data Collection
Data is shared by market participants, then collected and aggregated to reflect real pricing dynamics across key feed additive markets.
2. Data Processing
Kemiex structures and anonymizes the data to ensure accuracy, confidentiality, and reliable benchmarking. Our algorithms exclude outliers and prices that differ too much from the market, to ensure accuracy.
3. Price Distribution
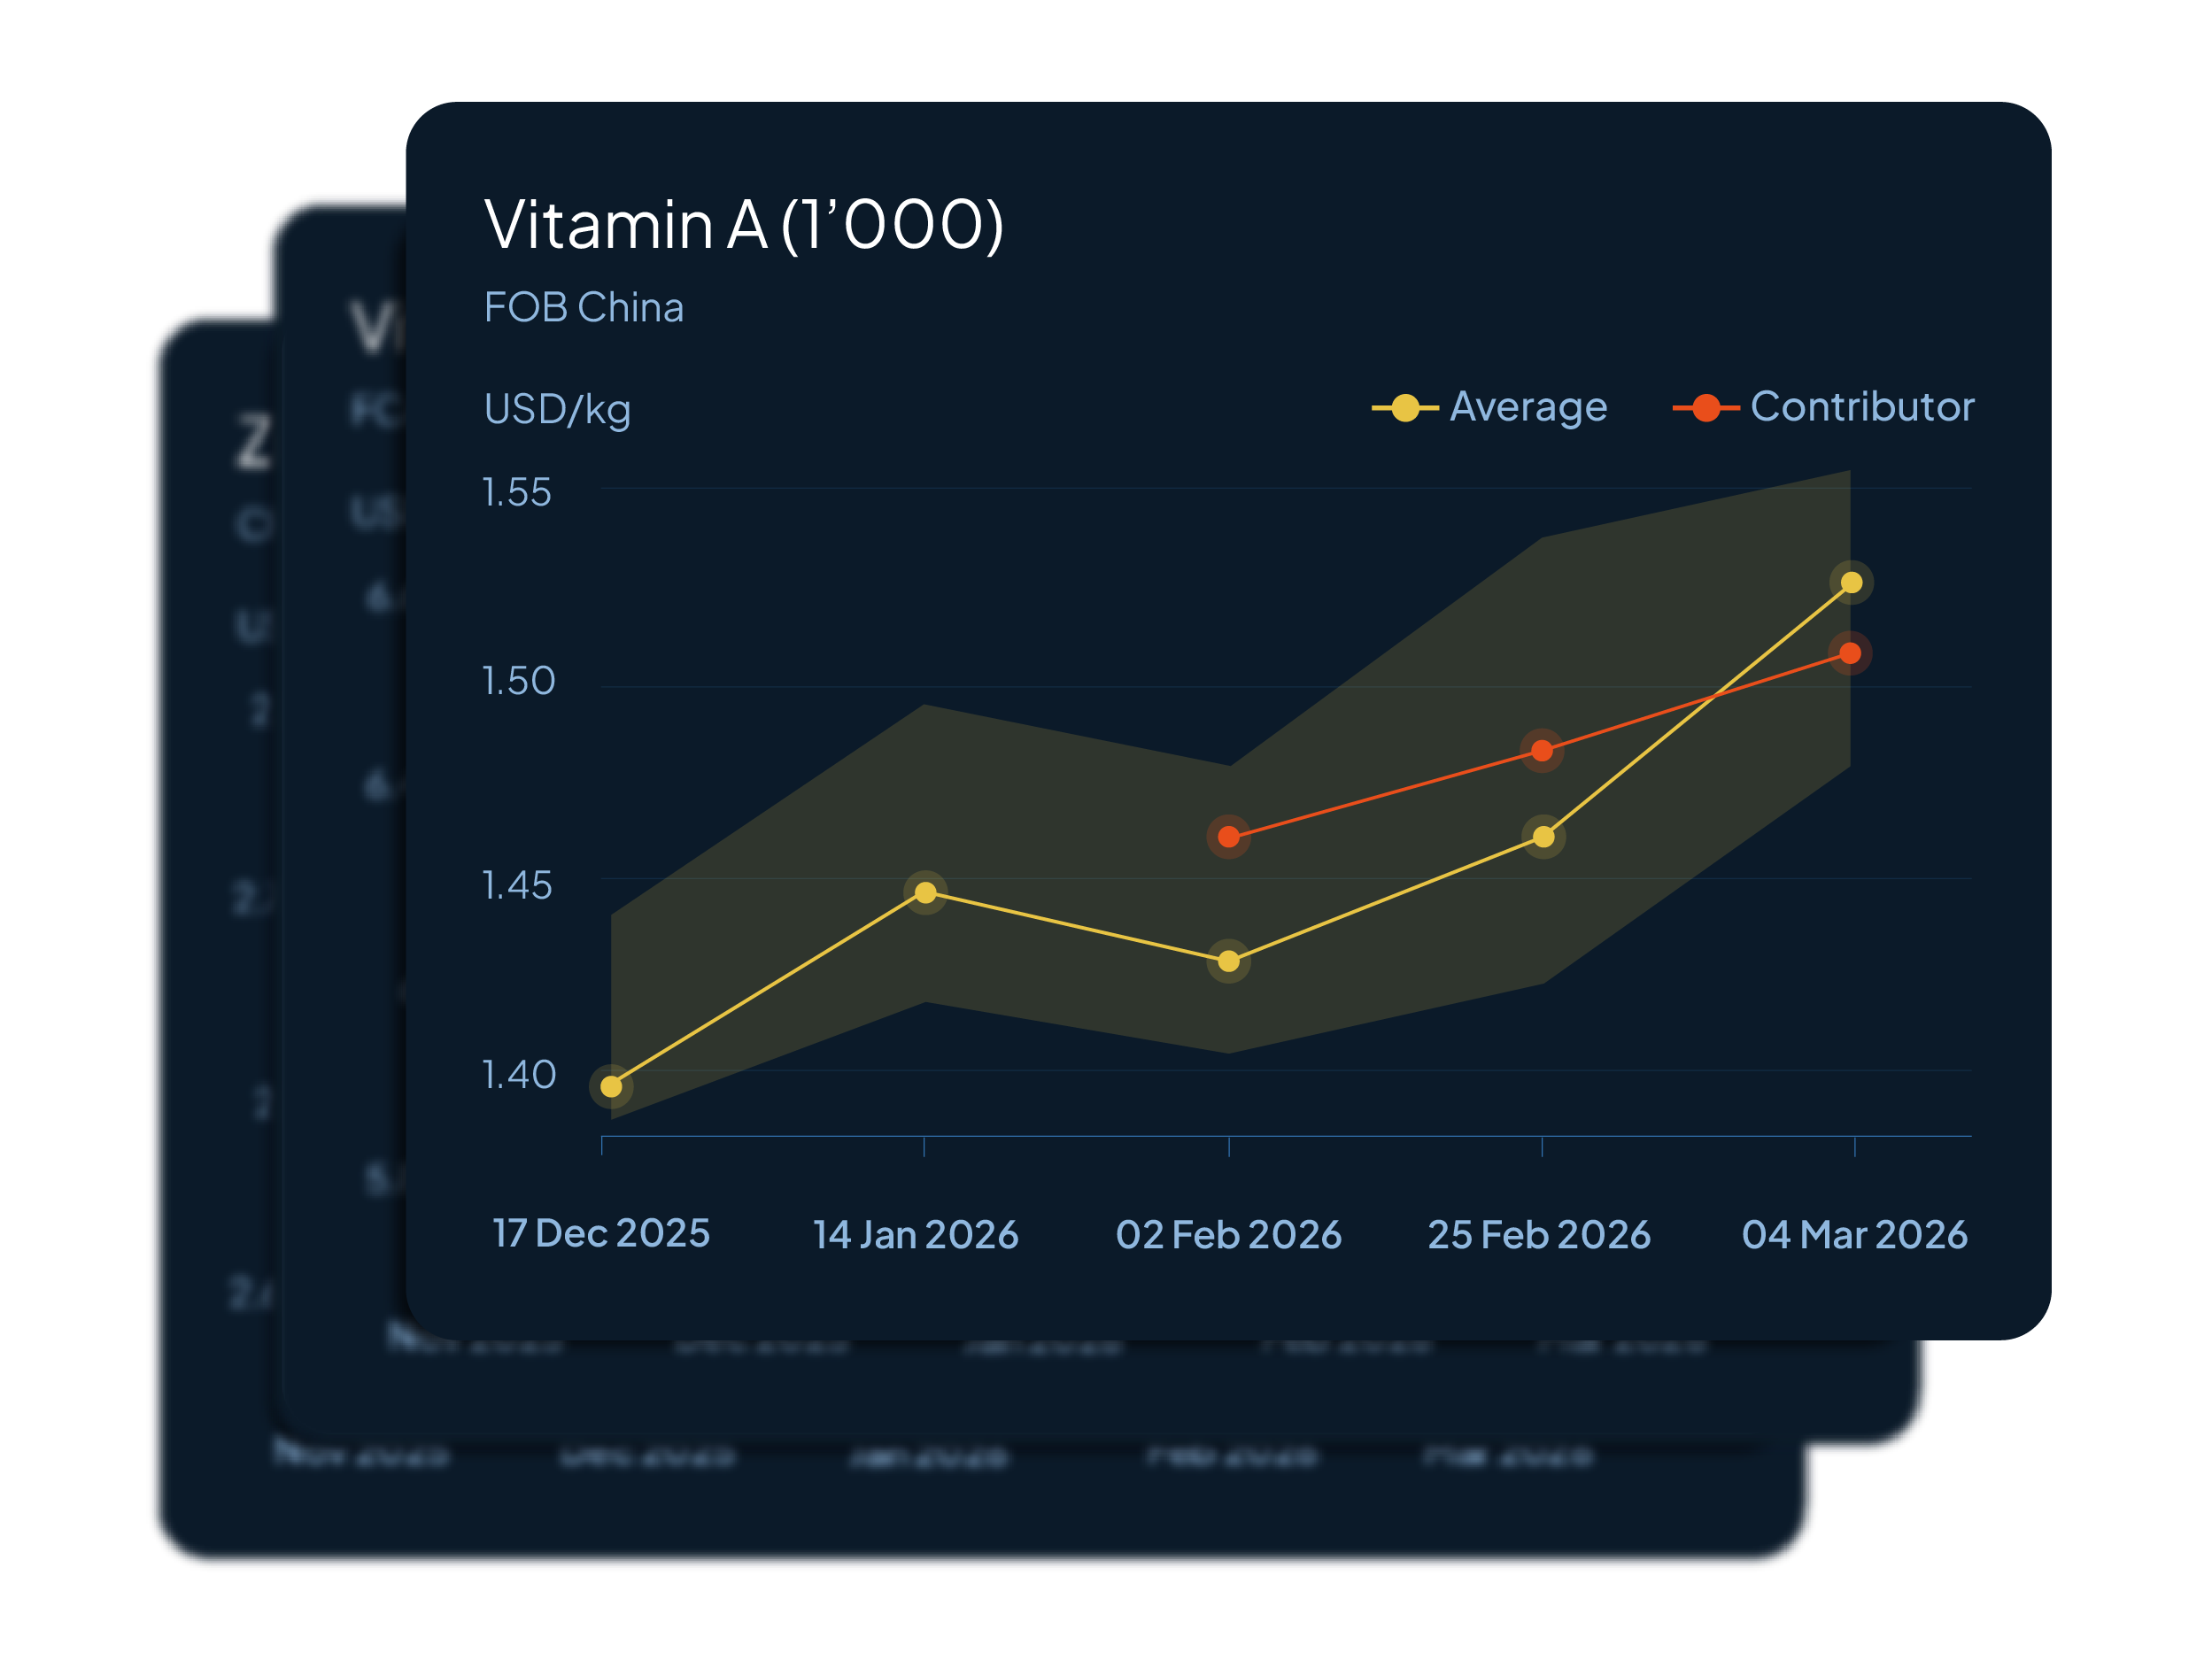
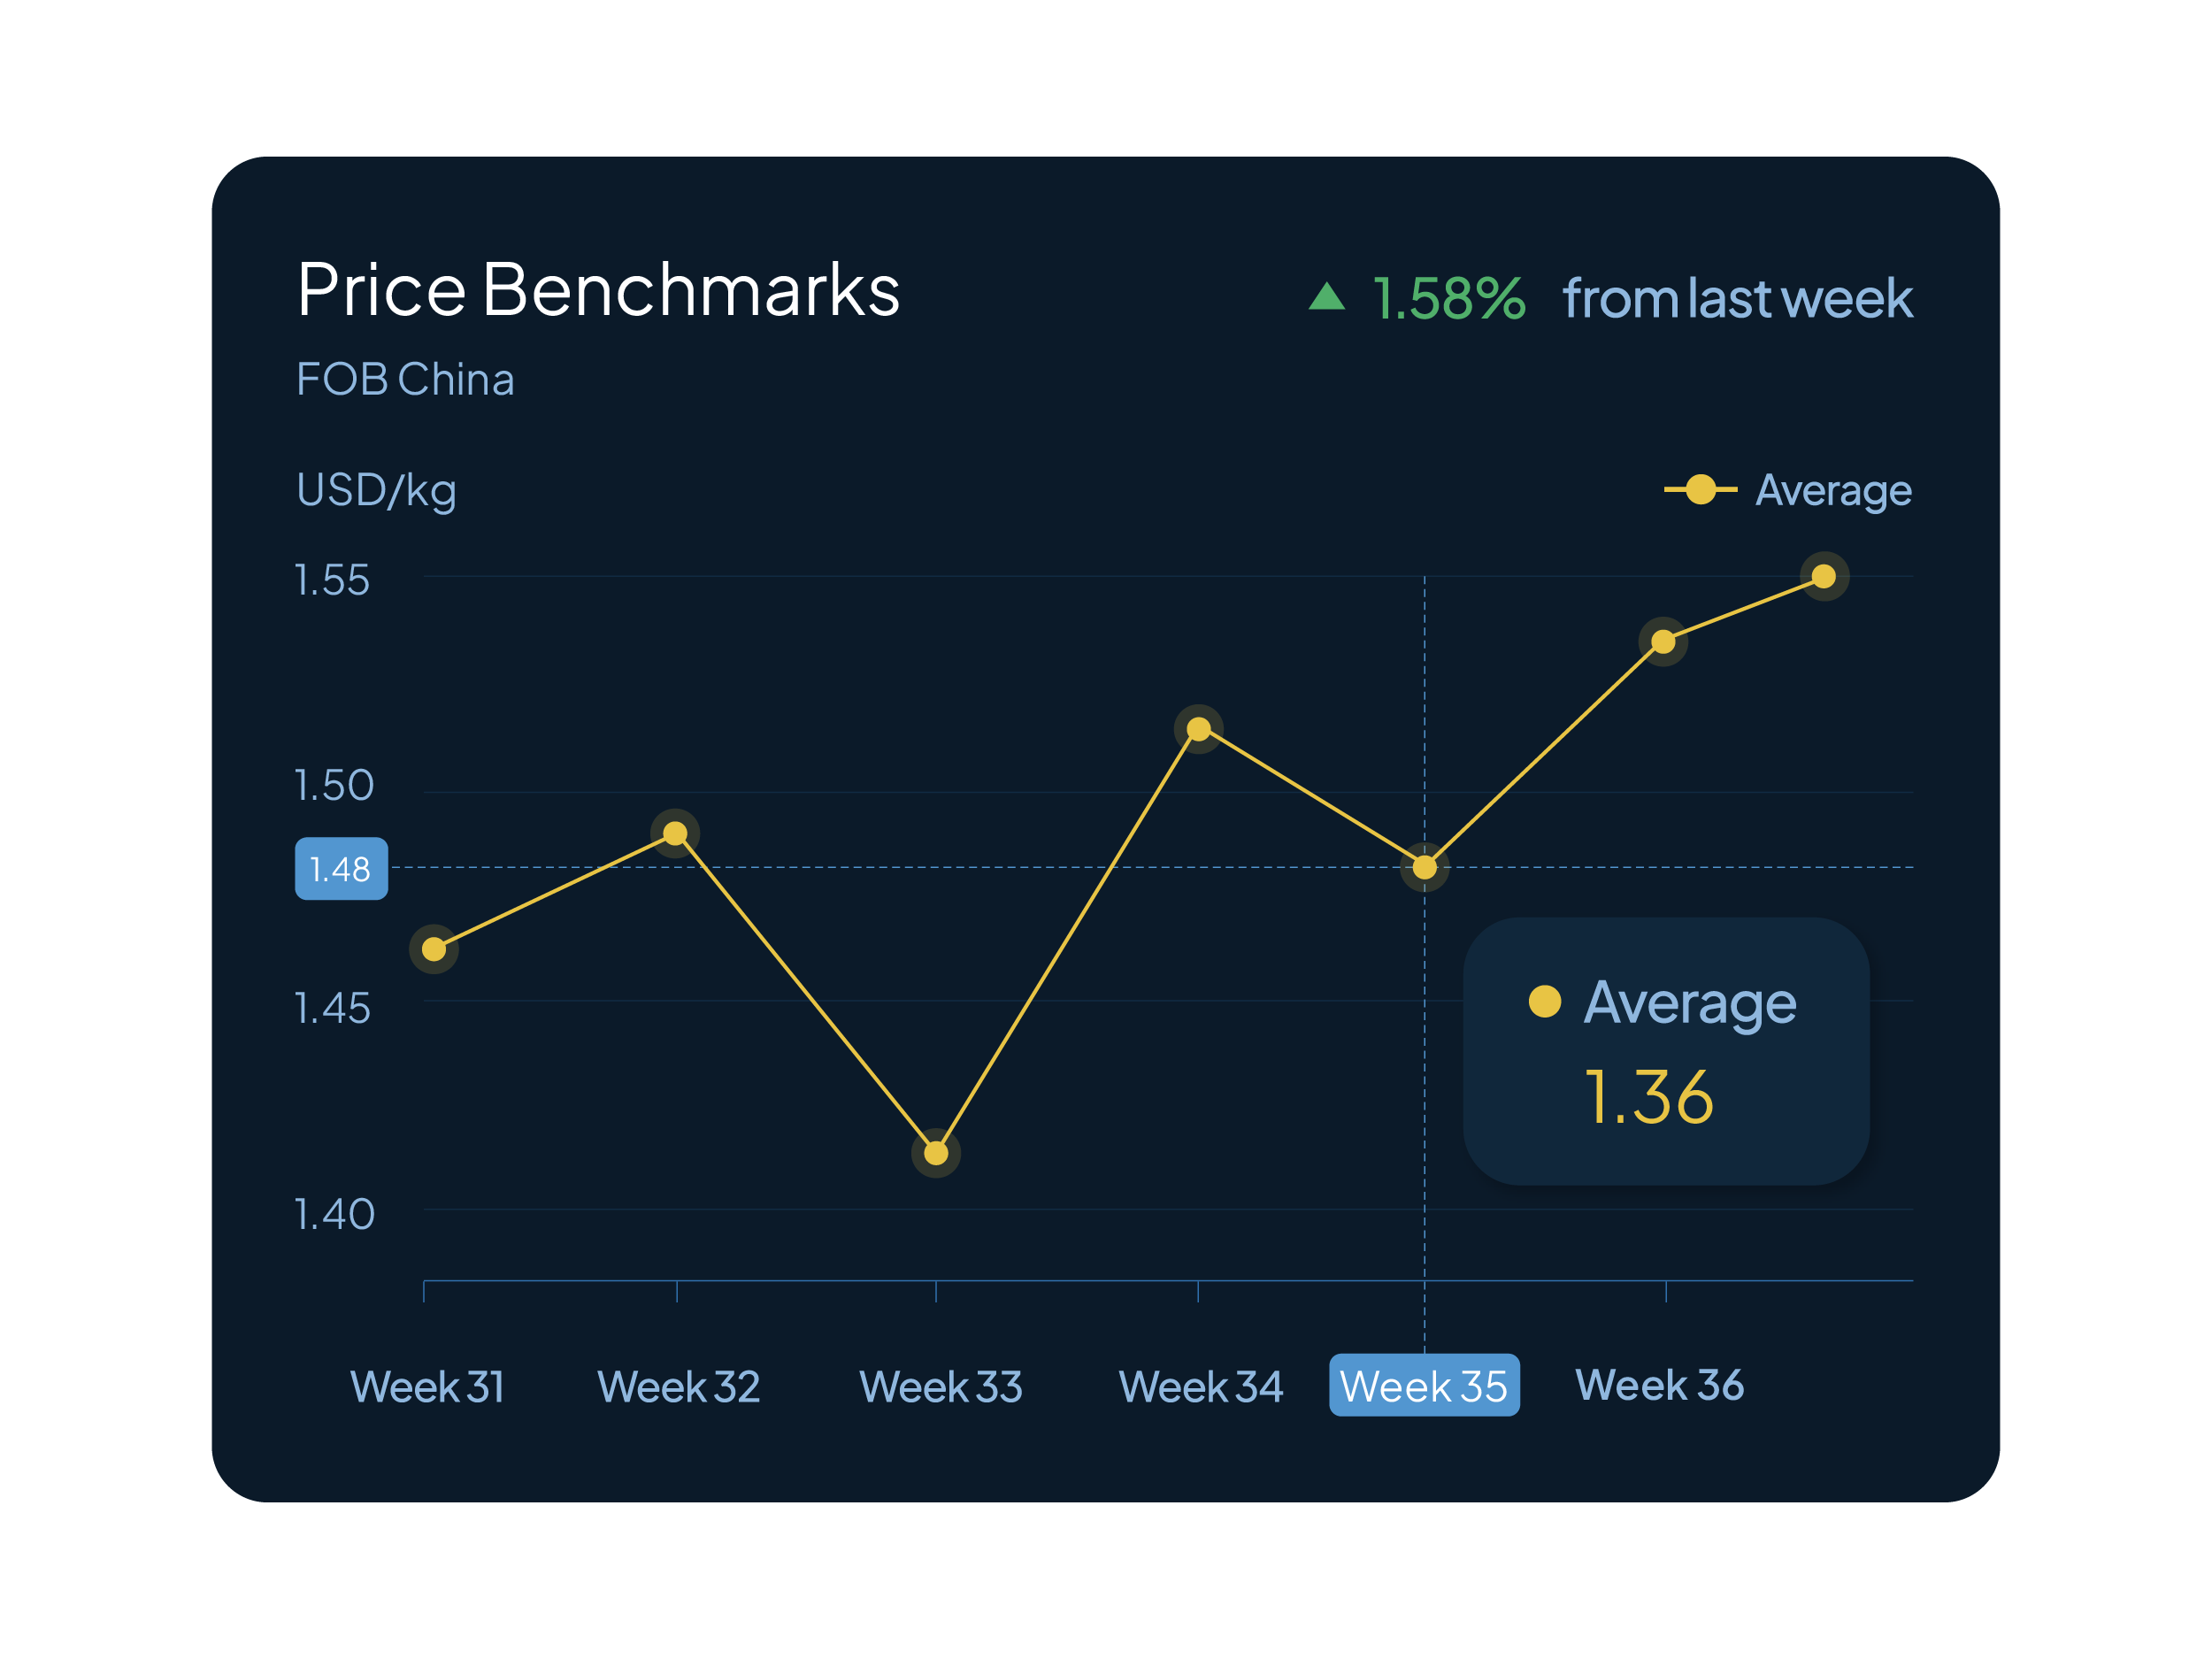
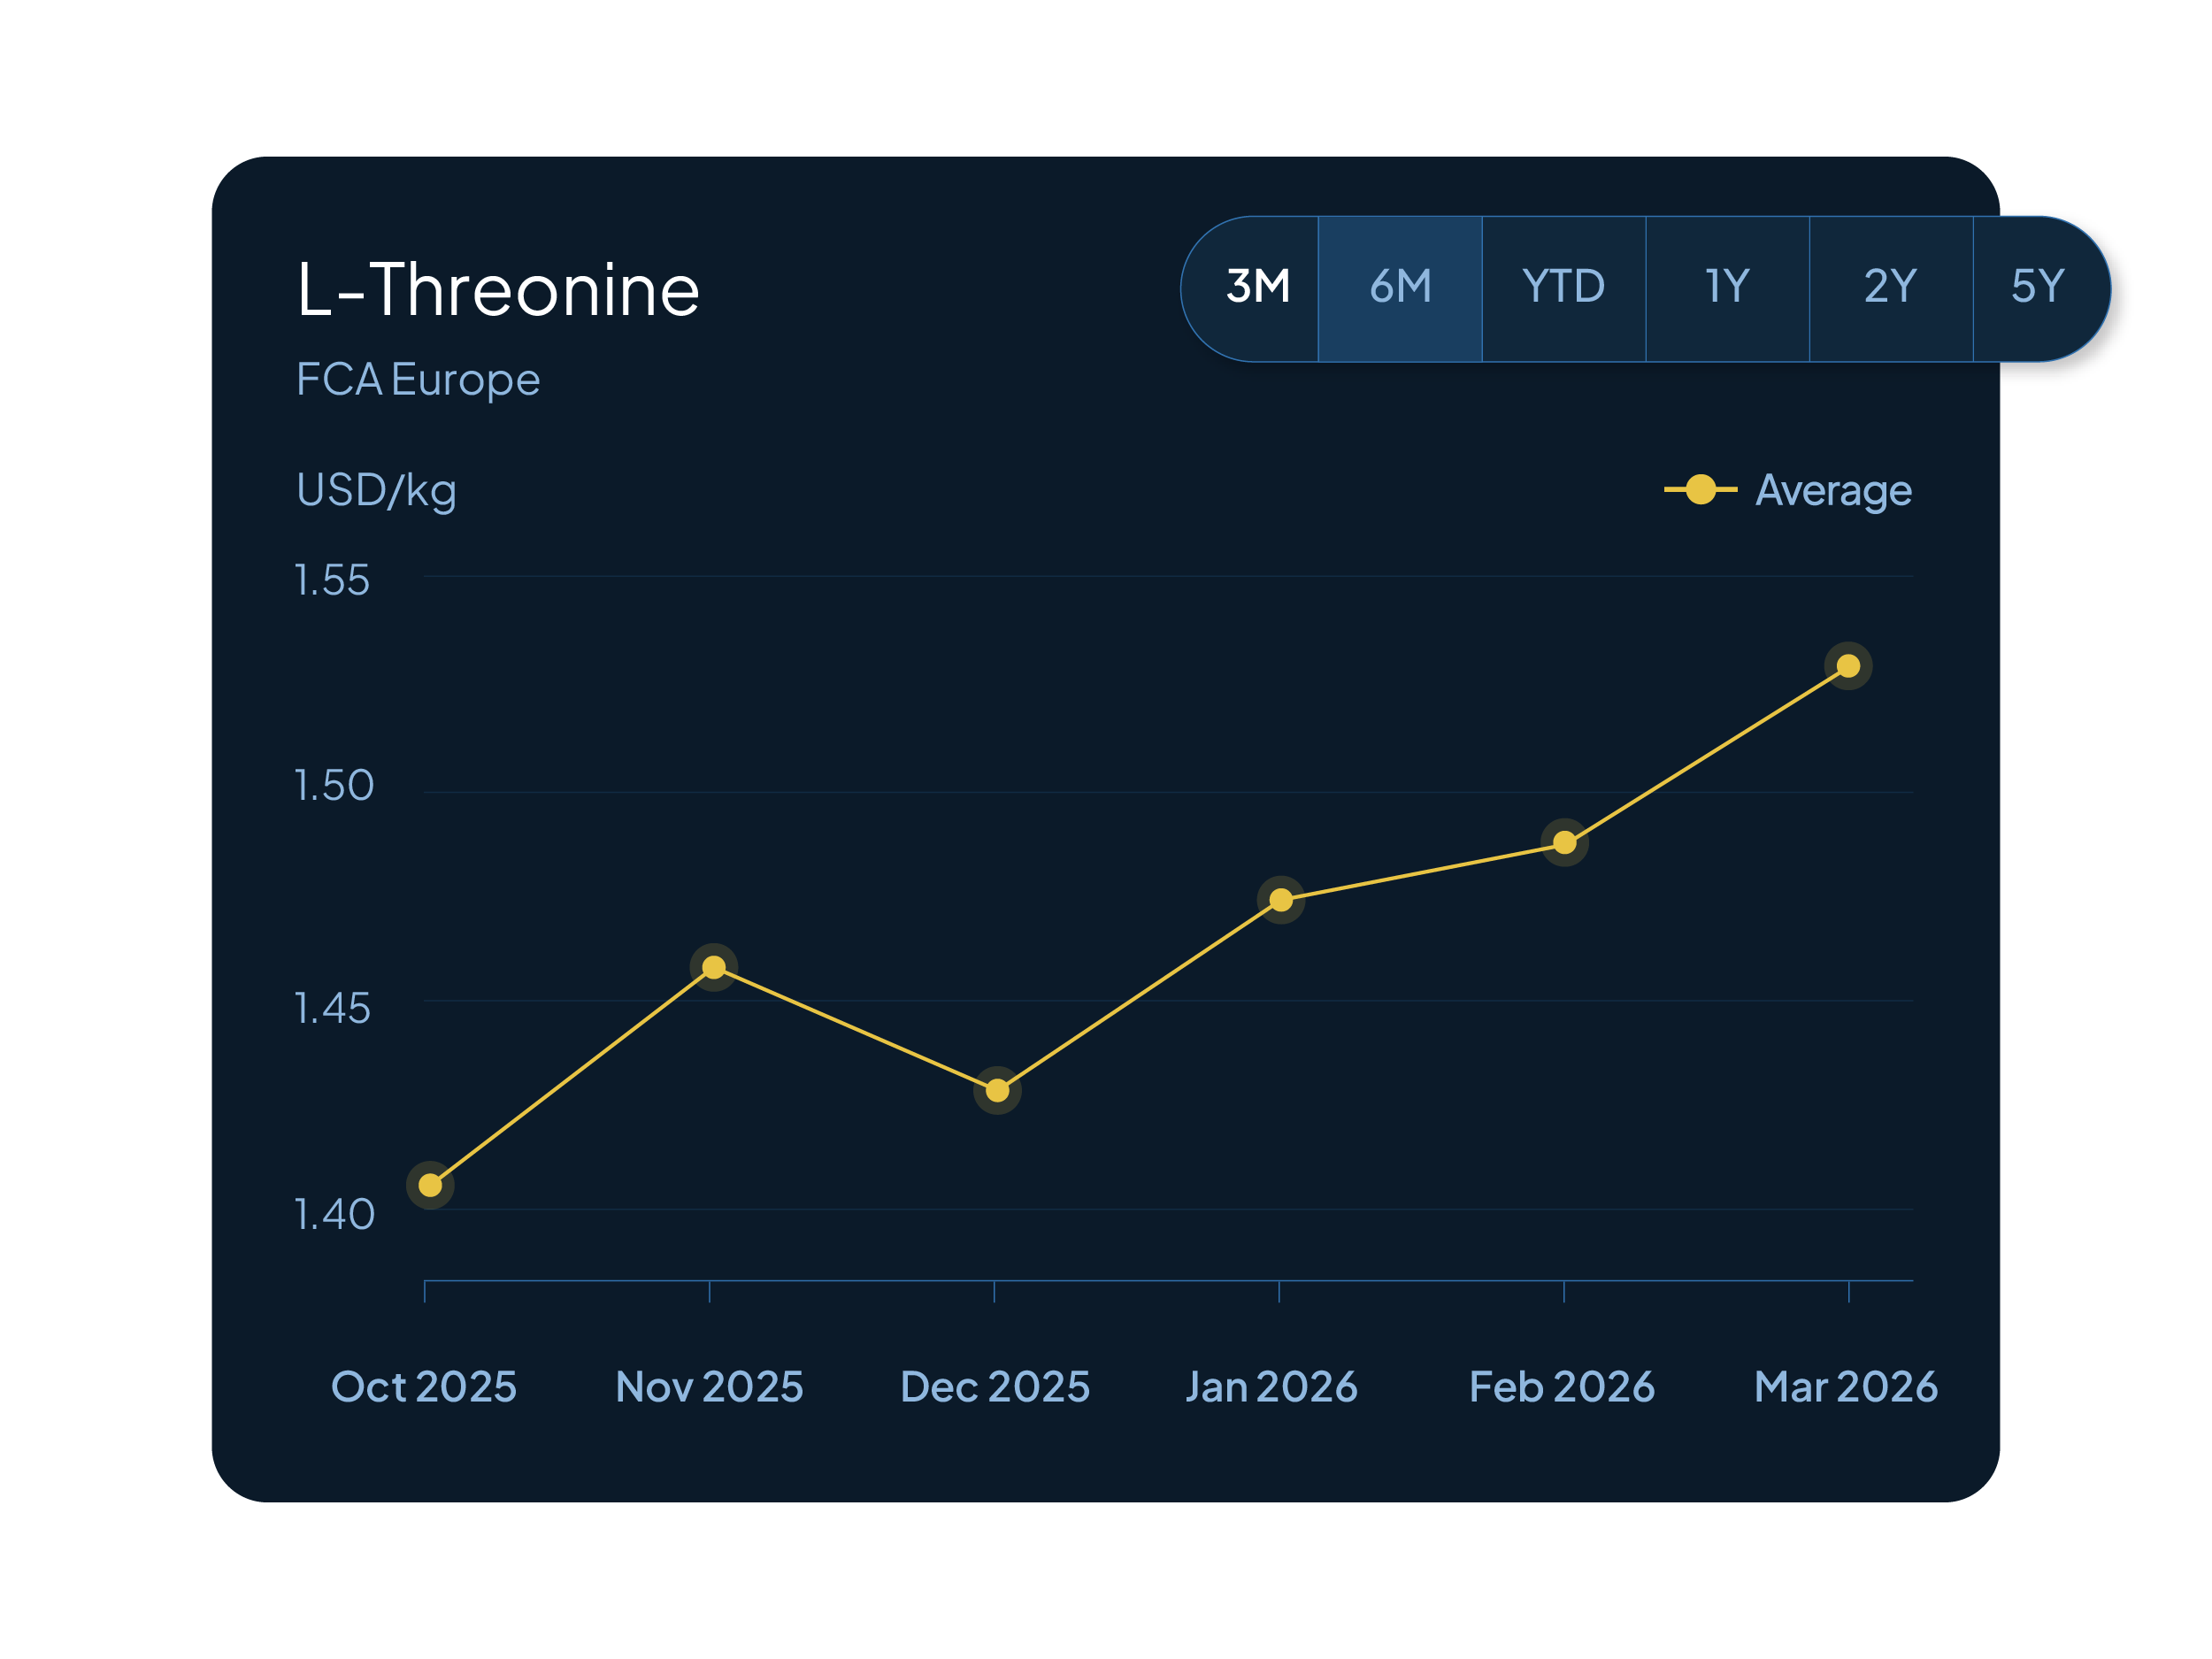
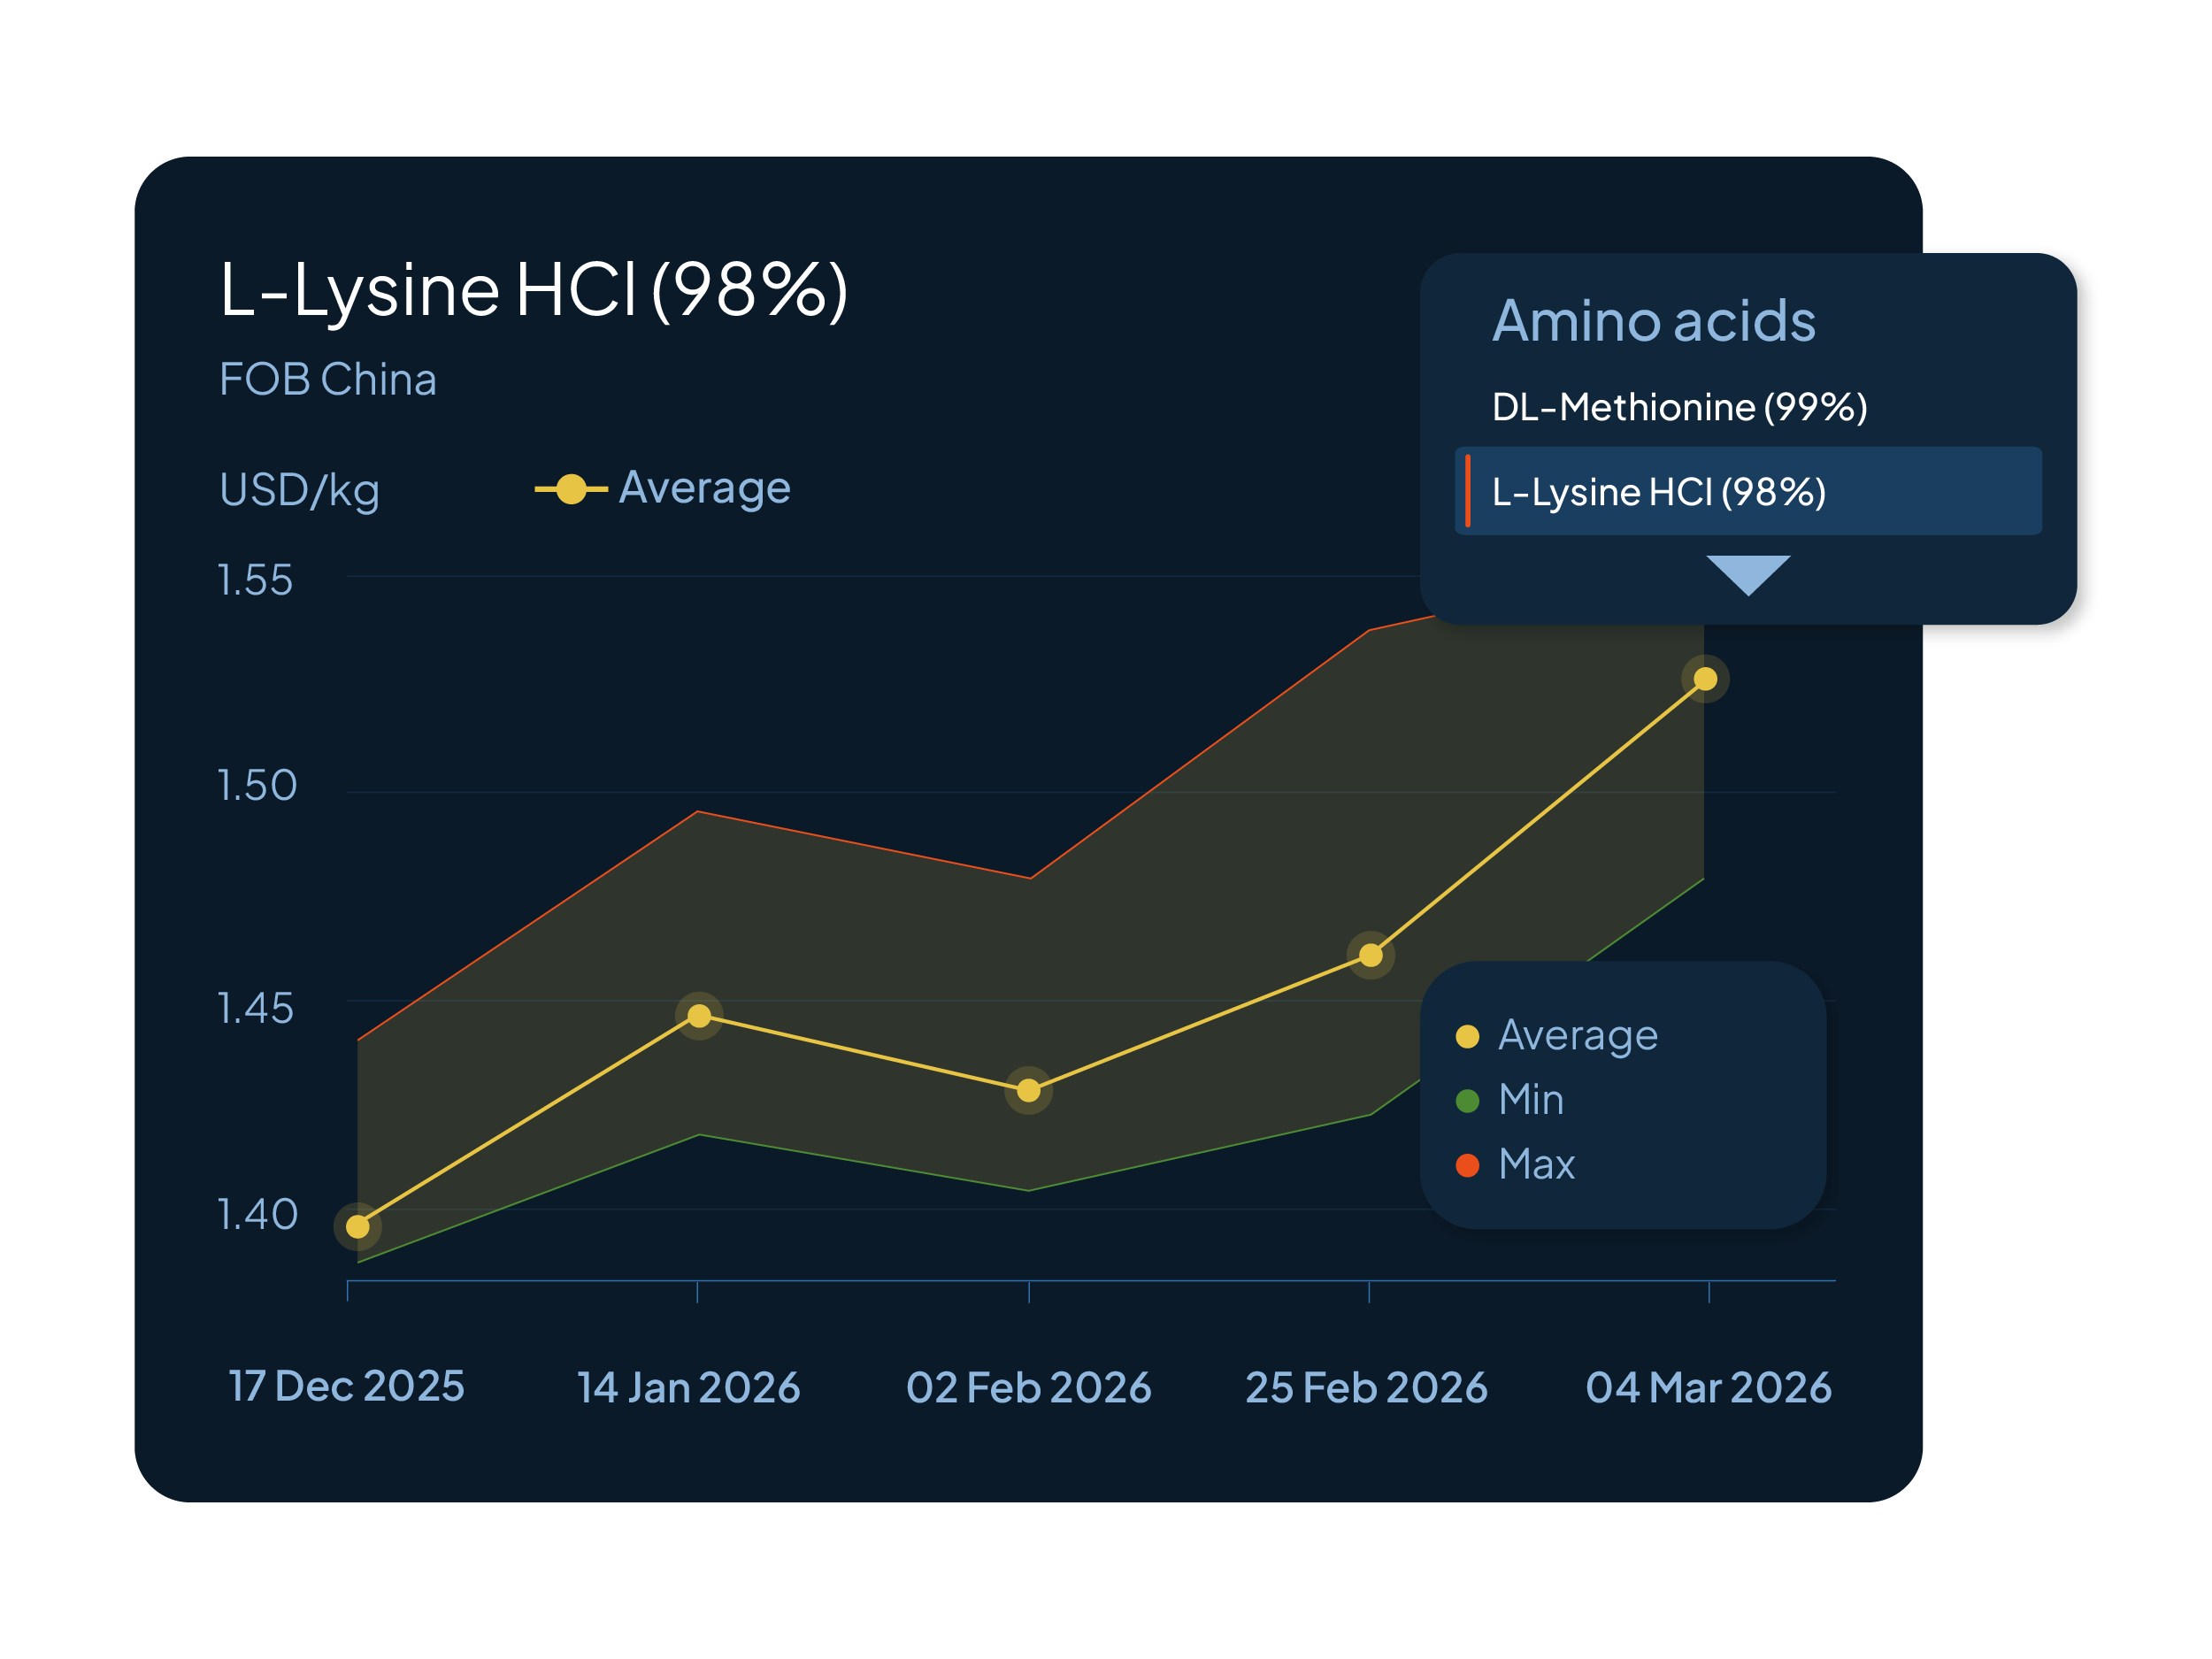
Price Benchmarks reveals the full price range per product every week, including minimum, maximum, and average values.
4. Weekly Benchmark Updates
Users receive weekly notifications including a summary of the prices and a tailored commentary that reflects the latest market developments and provides context.
Real Price Ranges (min/max/avg)
Unlike traditional price reports that rely on a single data point, Price Benchmarks shows the full market price distribution including the following:
- minimum price
- average price
- maximum price
This helps you quickly determine whether a supplier quote is competitive or above the market range.
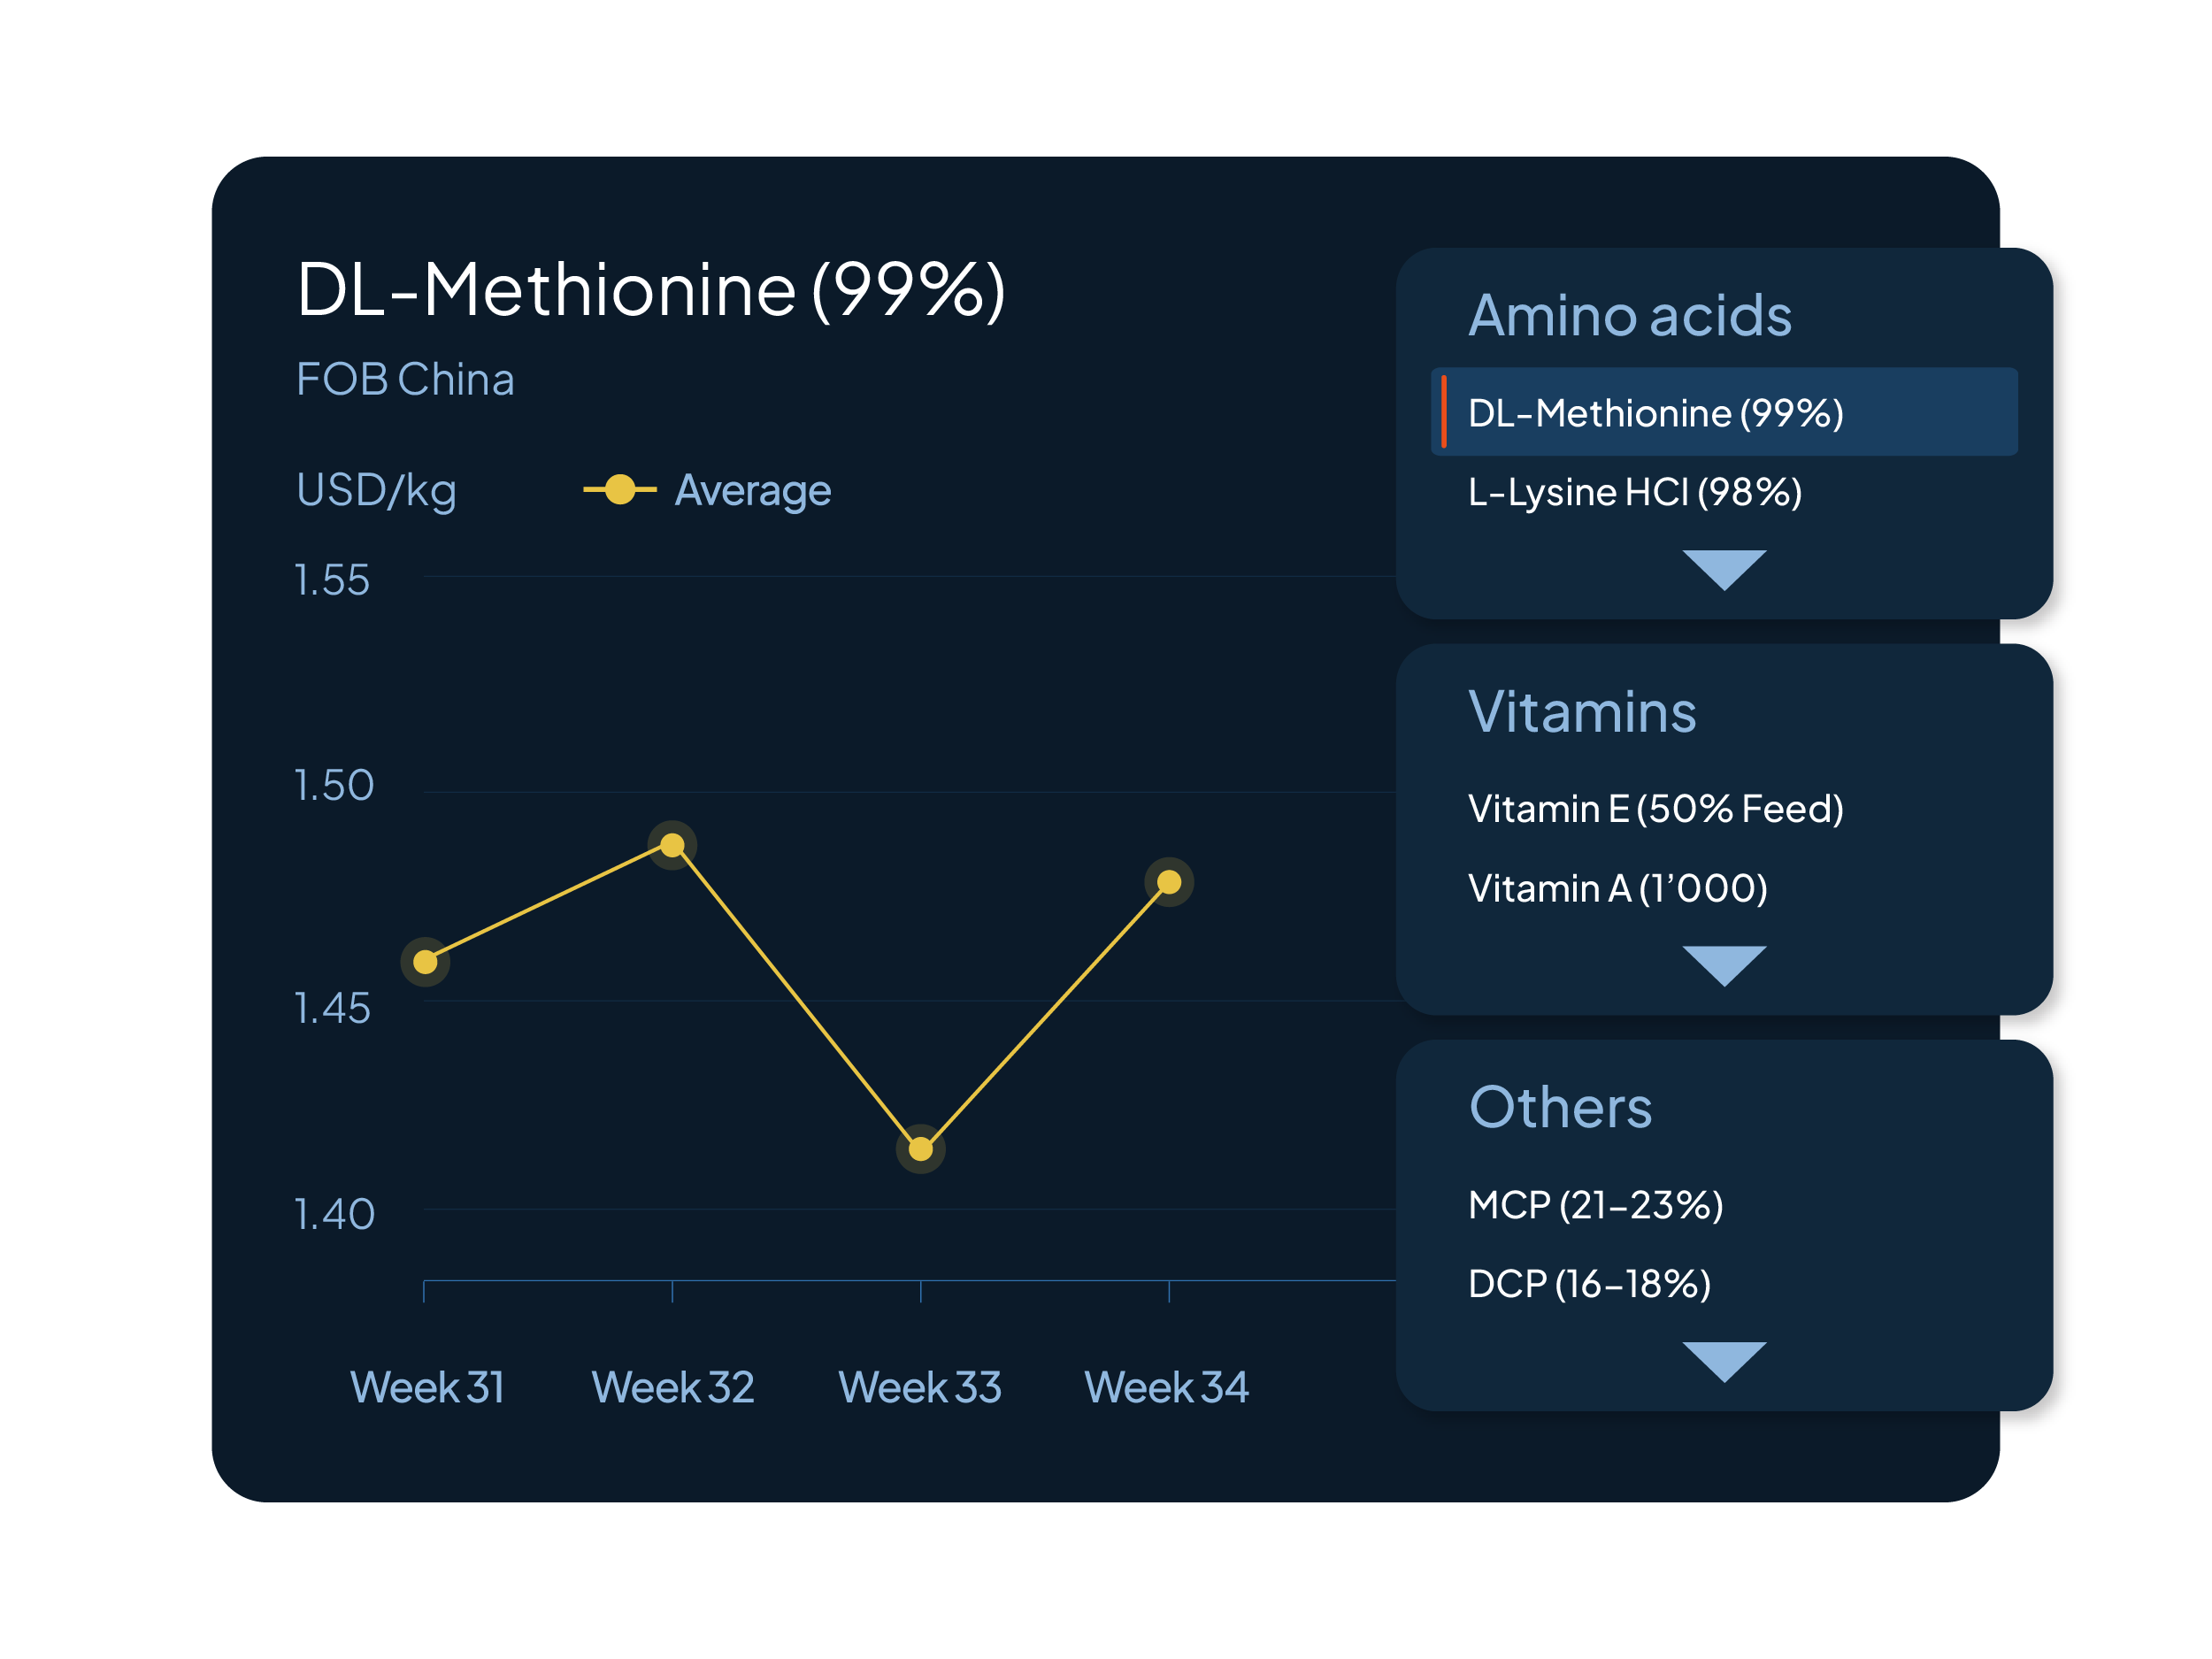
30+ Products Covered
Weekly price benchmarks for more than 30 products across key categories including:
- Vitamins
- Amino acids
- Minerals
- Feed additives
- and more
Historical Price Coverage
Historical price data going back up to 5 years depending on the product, allowing you to analyze both short-term movements and long-term market trends.
Use it to:
-
Track recent price movements
-
Identify longer-term market trends
-
Compare current prices with historical ranges
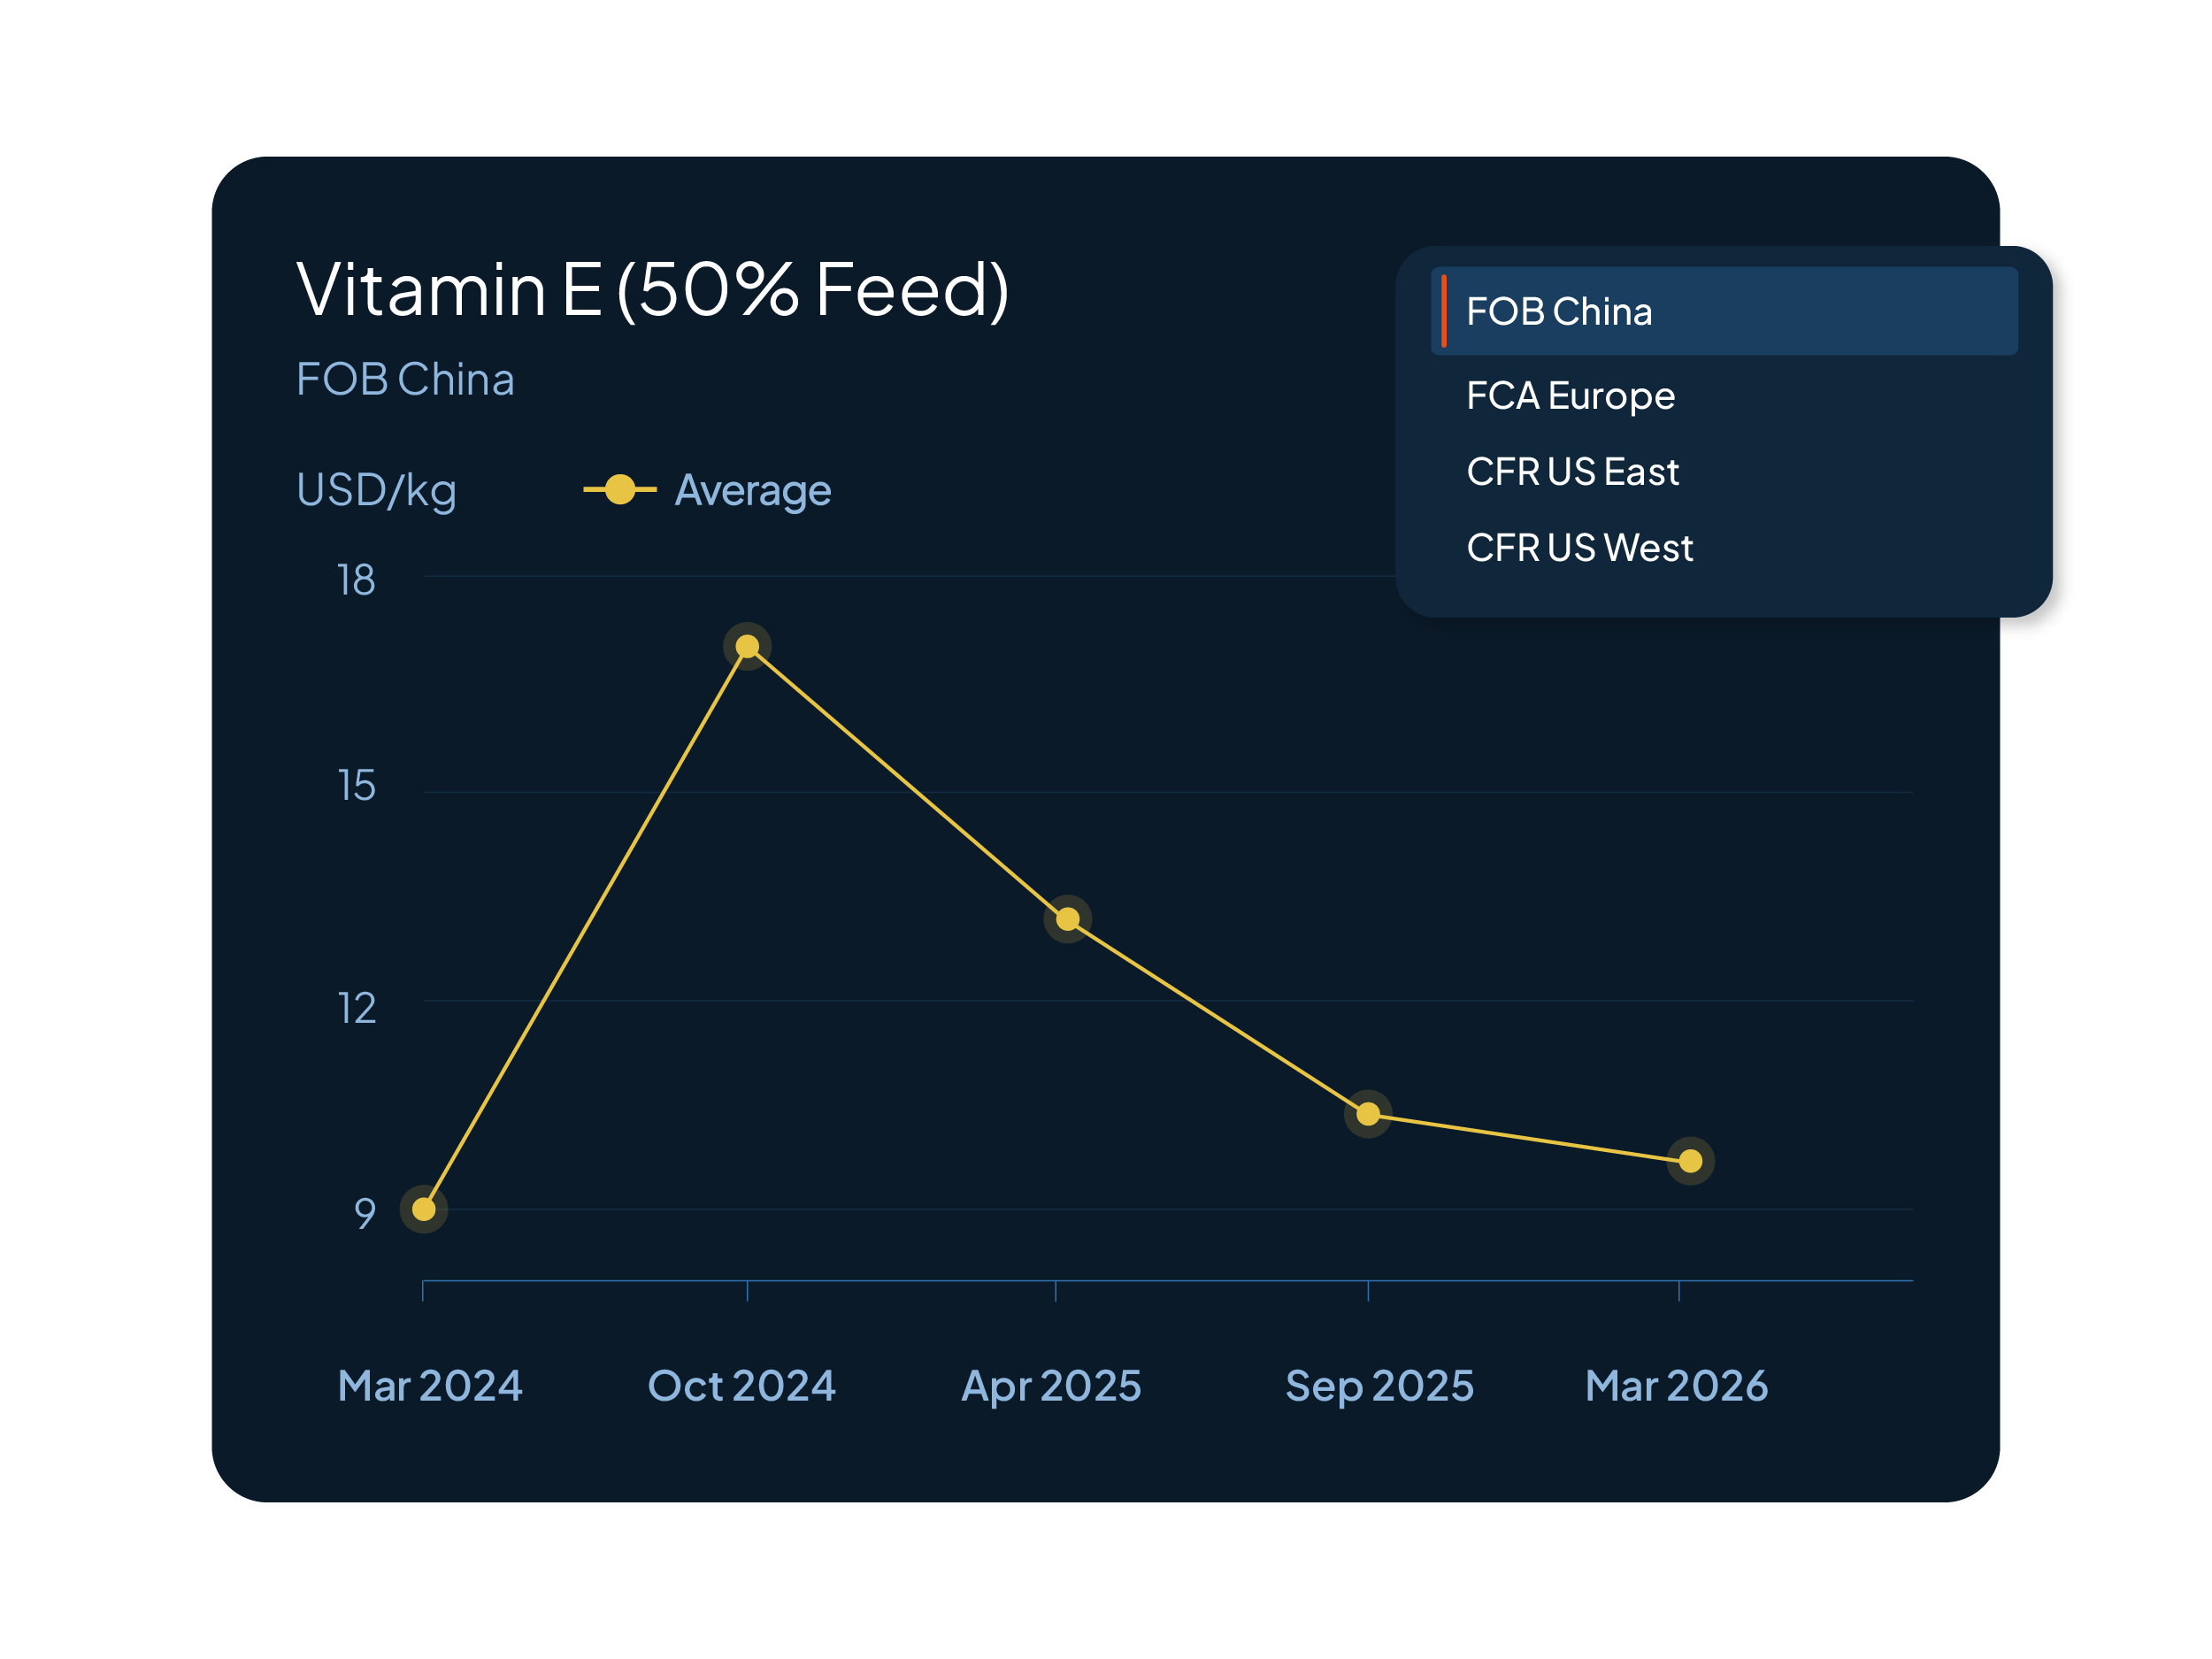
Global Price Benchmarks
Price Benchmarks across major global delivery points, including:
-
FOB China
-
FCA Europe
-
CFR US East
-
CFR US West
This allows you to compare pricing across key trading hubs and understand regional market differences.
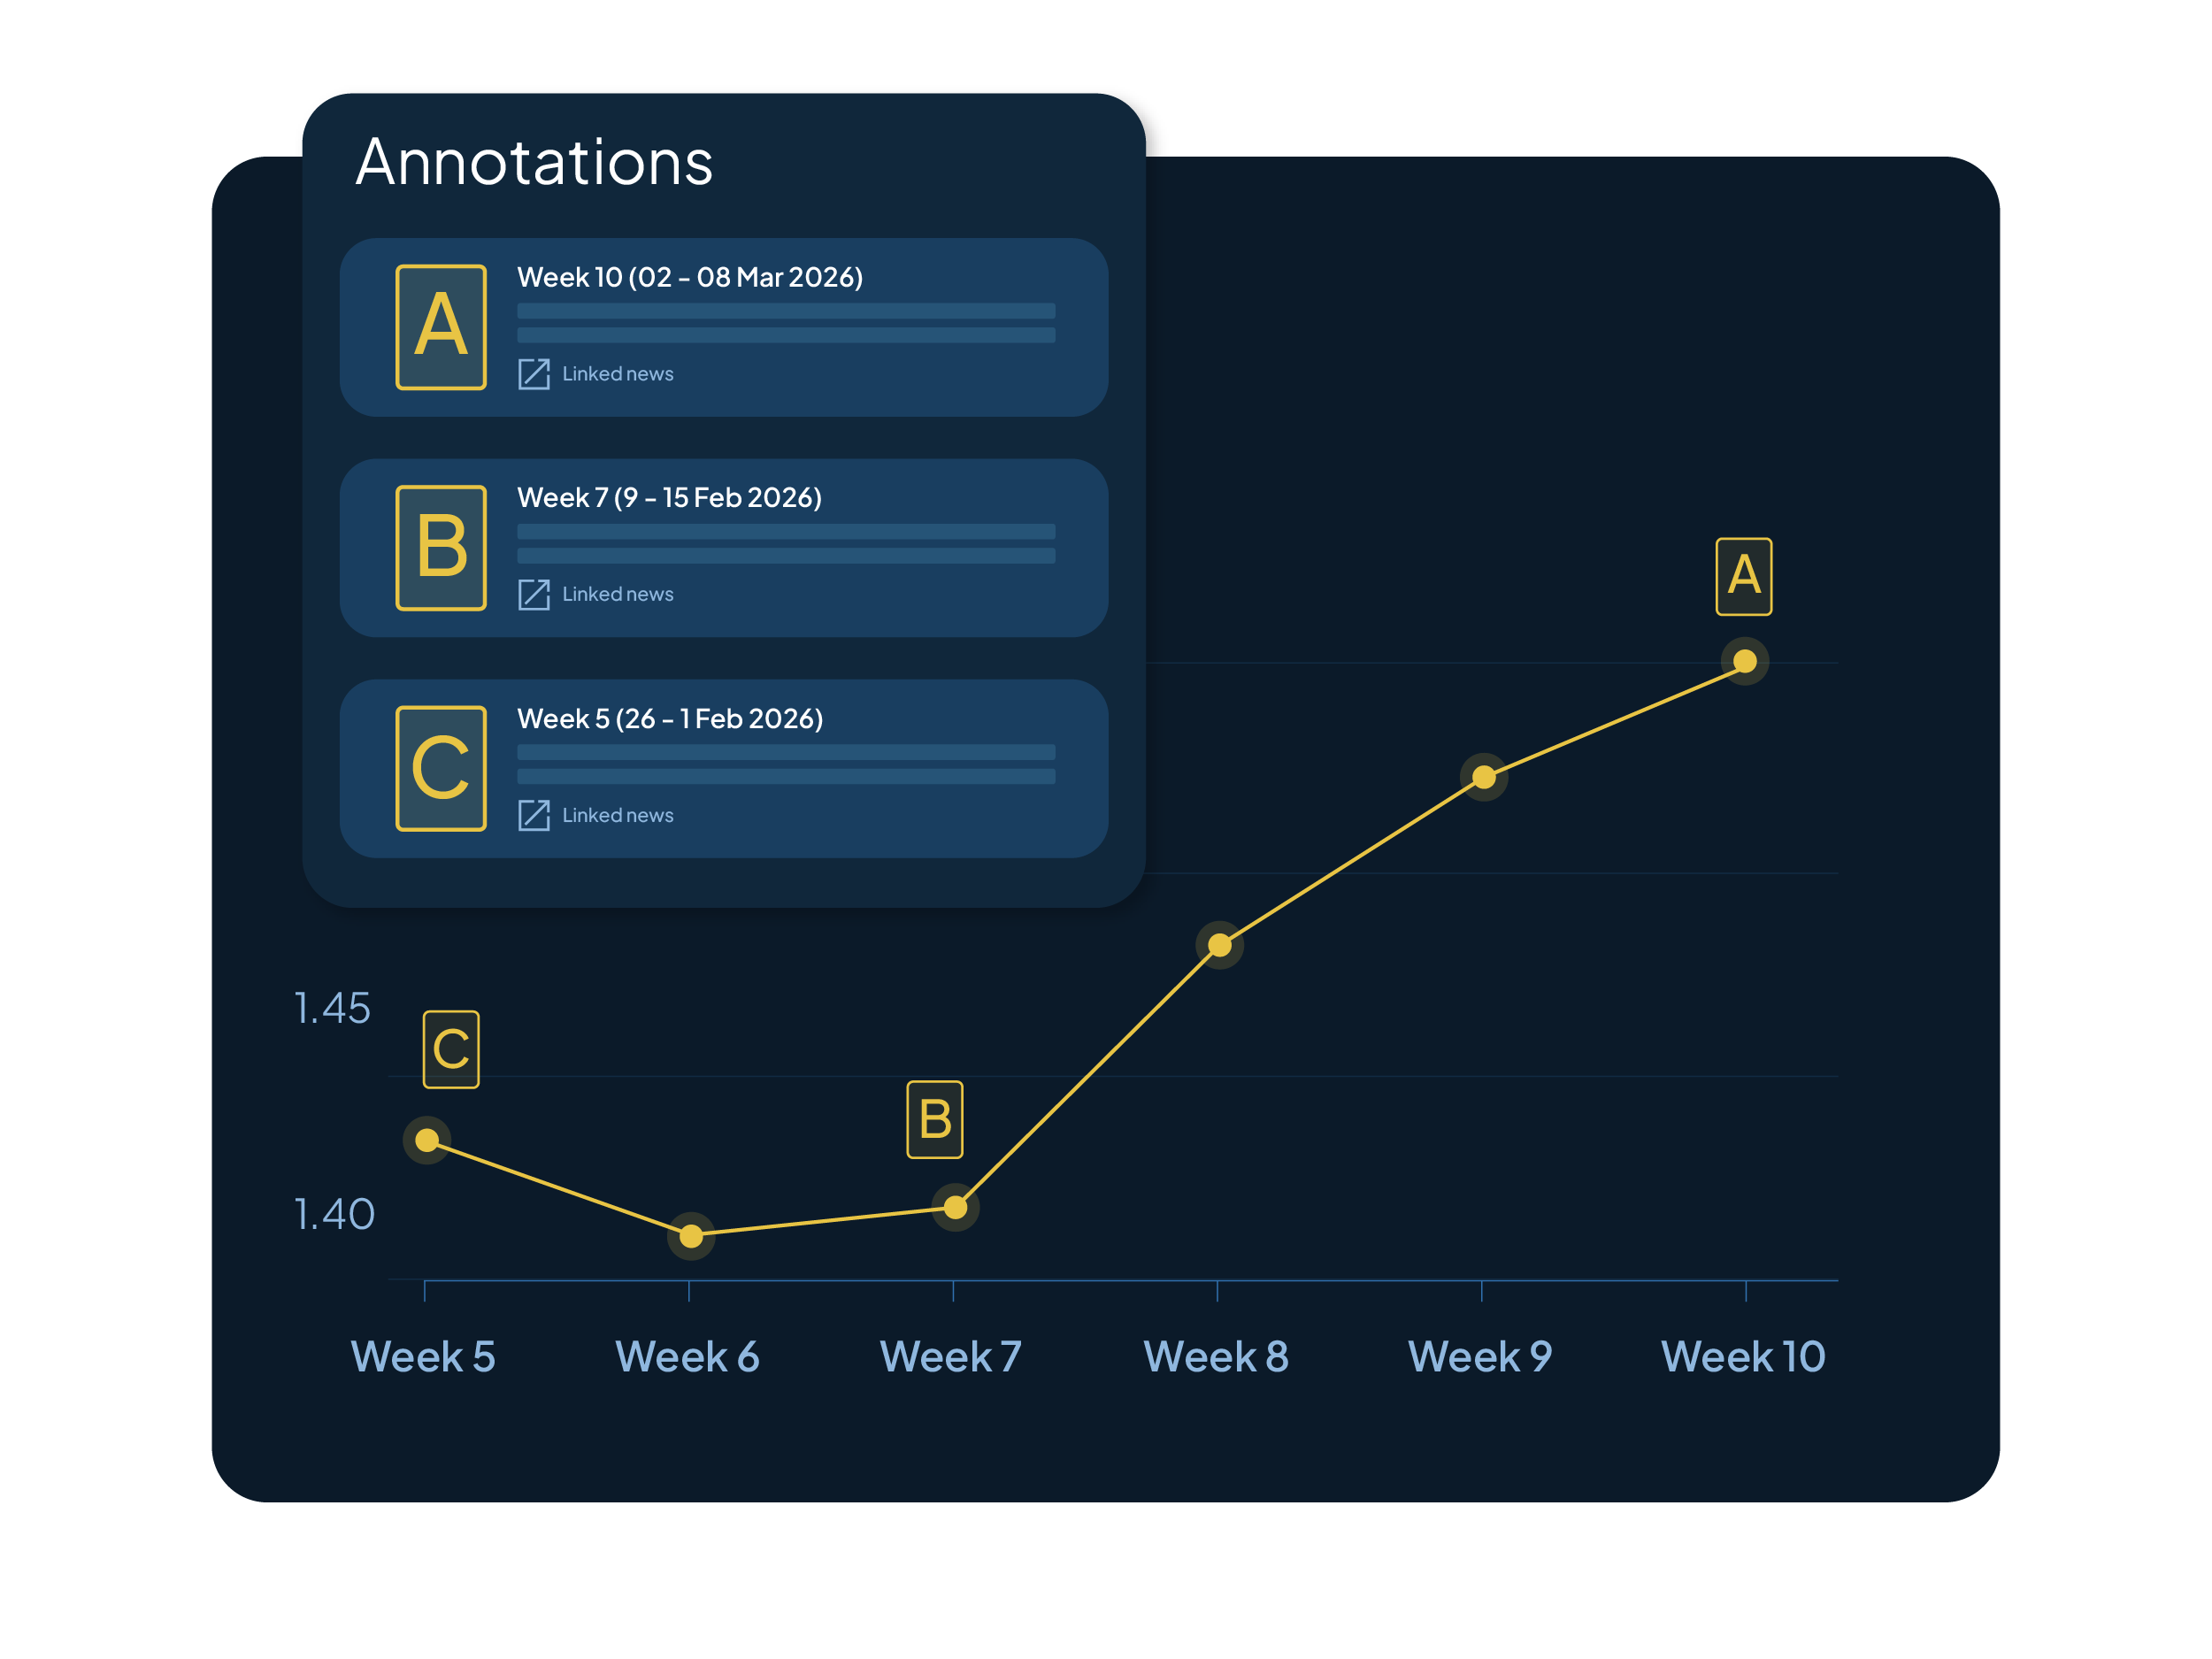
Market Chatter & News
Access relevant market commentary collected directly from market participants and industry news linked to each product to better understand price movements.
Includes:
-
Market commentary providing context about events shaping the industry
- Weekly annotations explaining movements for the product in the region
-
Industry news affecting supply, demand, or trade dynamics
-
Contextual insights helping you understand why prices are moving
How Price Benchmarks Helps You
-
Stronger negotiations
Evaluate supplier quotes with real market context -
Faster procurement decisions
Access clear market benchmarks without manually collecting multiple quotes. -
Reduced market uncertainty
Understand historical price movements and market volatility. -
Greater pricing transparency
Gain visibility into the full range of prices across the market.
What You Get
Each week, Price Benchmarks is updated with the latest market data, giving procurement and commercial teams a consistent view of pricing developments across key products.
Weekly benchmark report
Receive a concise weekly report summarizing key price movements.
Updated benchmark ranges
Minimum, average, and maximum transaction levels are refreshed based on the latest reported market data.
Market context and developments
Relevant market chatter and news help explain the drivers behind recent price changes.
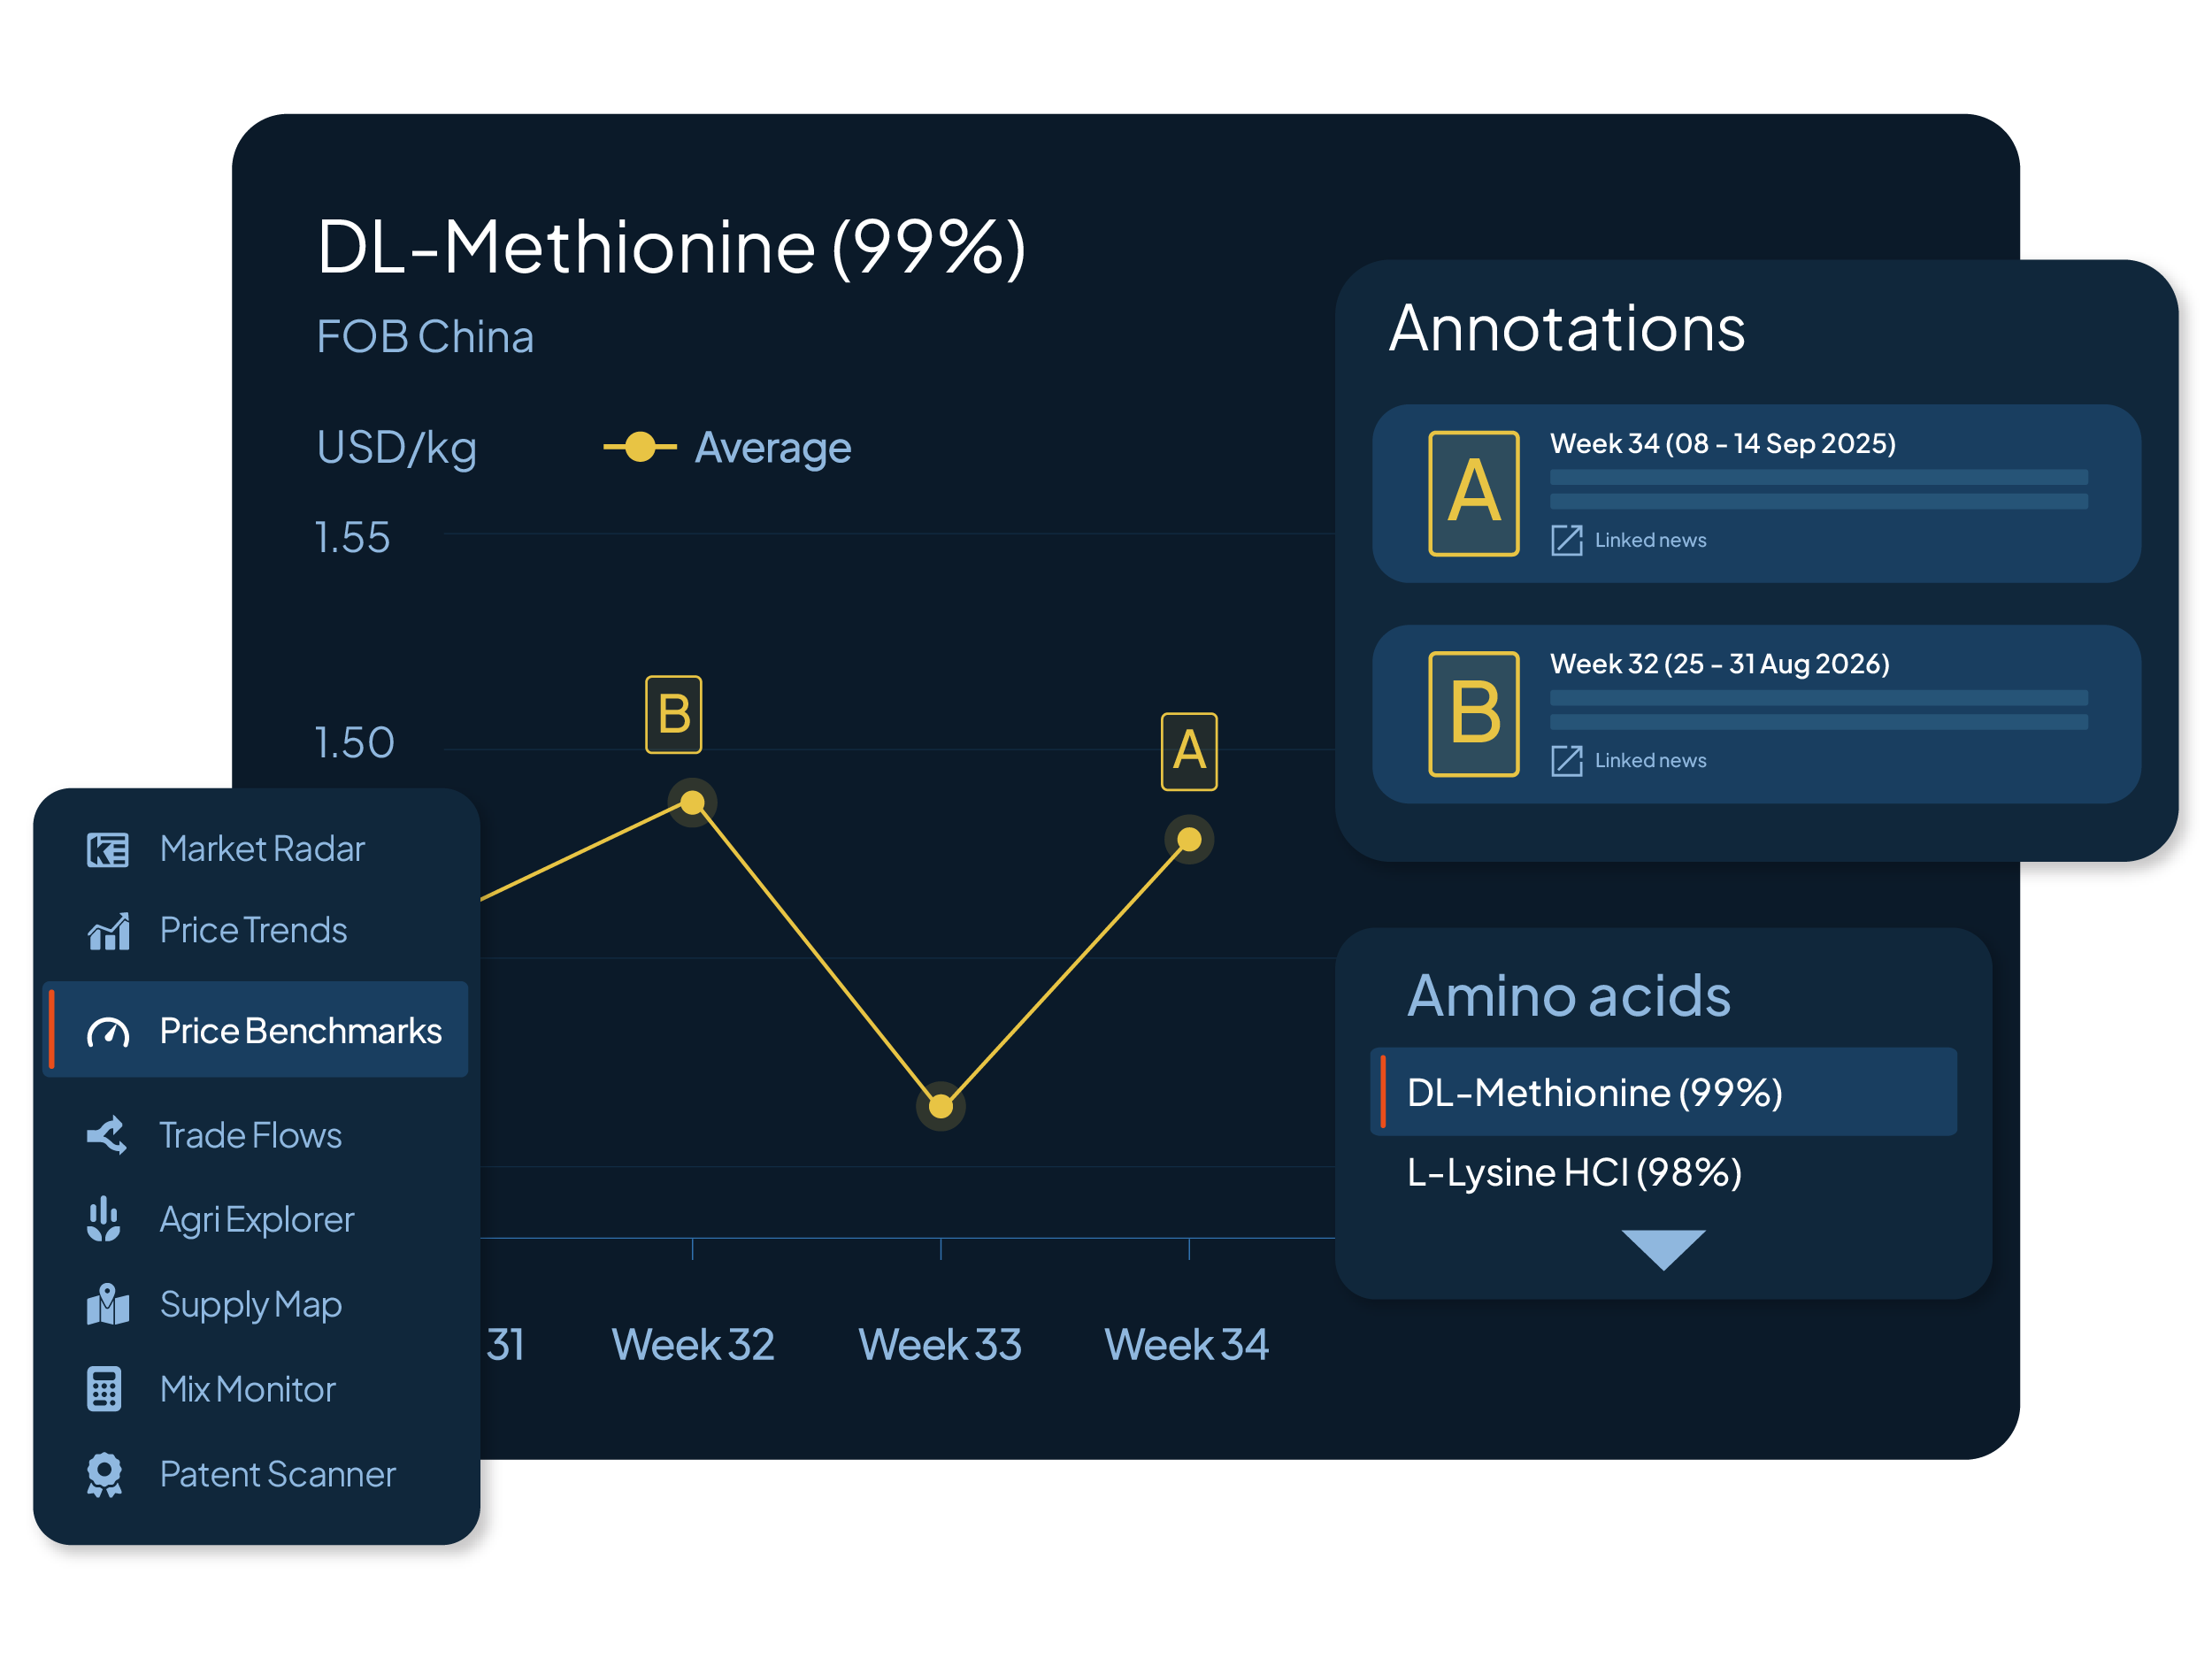
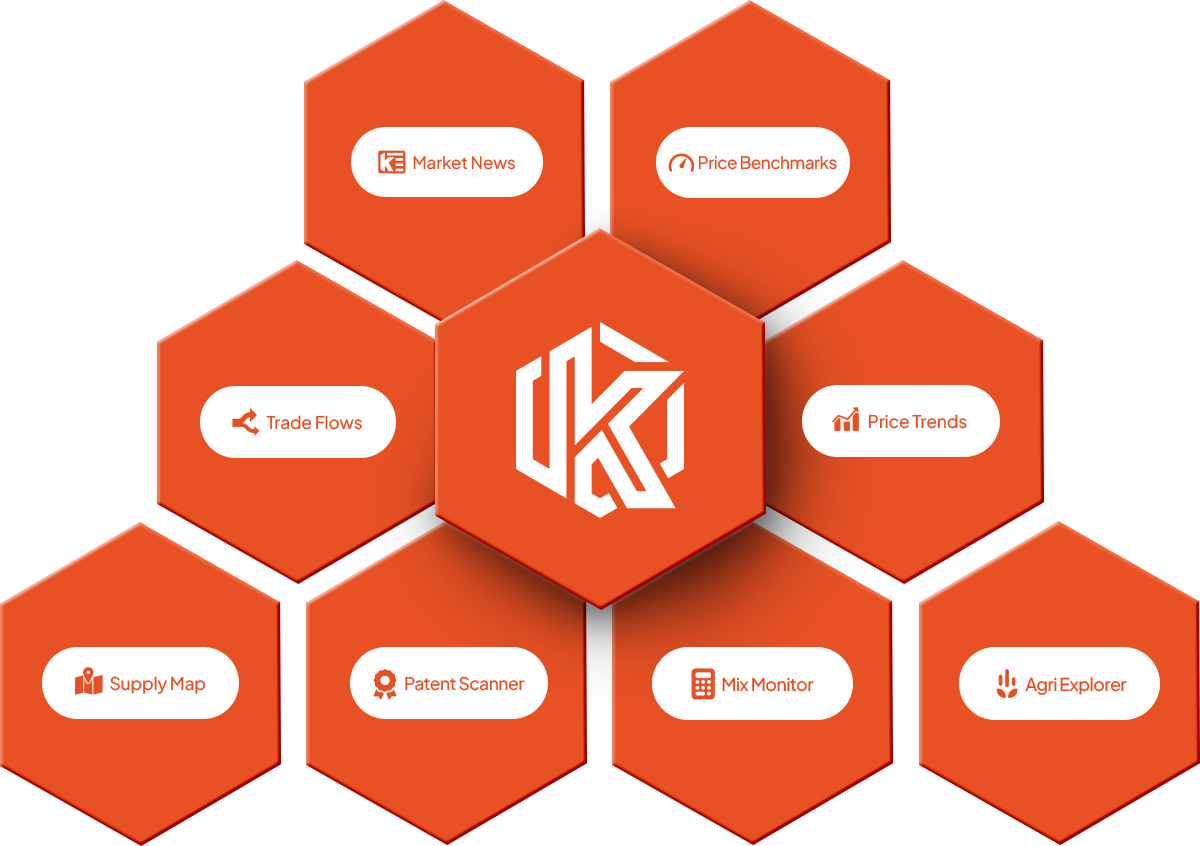
Integrated Within Market Radar
Price Benchmarks are connected to the broader Market Radar ecosystem.
When reviewing benchmark price movements, you can immediately:
- Explore longer-term developments through Price Trends
- Understand market drivers through Market News
- Assess regional exposure via Trade Flows
- Evaluate cost implications using Mix Monitor
This integration ensures price movements are interpreted within the full market context rather than viewed in isolation.
Providing data-driven insights to 9000+ customers in 95+ countries