Key Takeaways
- China shipped 379,676 MT of L-Threonine in the first half of 2026, which is 4.6% more than the 362,852 MT it shipped in the first half of 2024, its record year.
- Russia and Spain are running at 44% and 41% of their 2025 volumes, well behind a market pacing at 55%, while Brazil sits at 68% and Poland at 71%.
- India took 20,179 MT in the first six months, more than in any full year through 2020, and now ranks fifth.
Figures are drawn from Kemiex trade flows and cover Chinese L-Threonine exports from 2017 to June 2026, with 2026 representing January to June only.
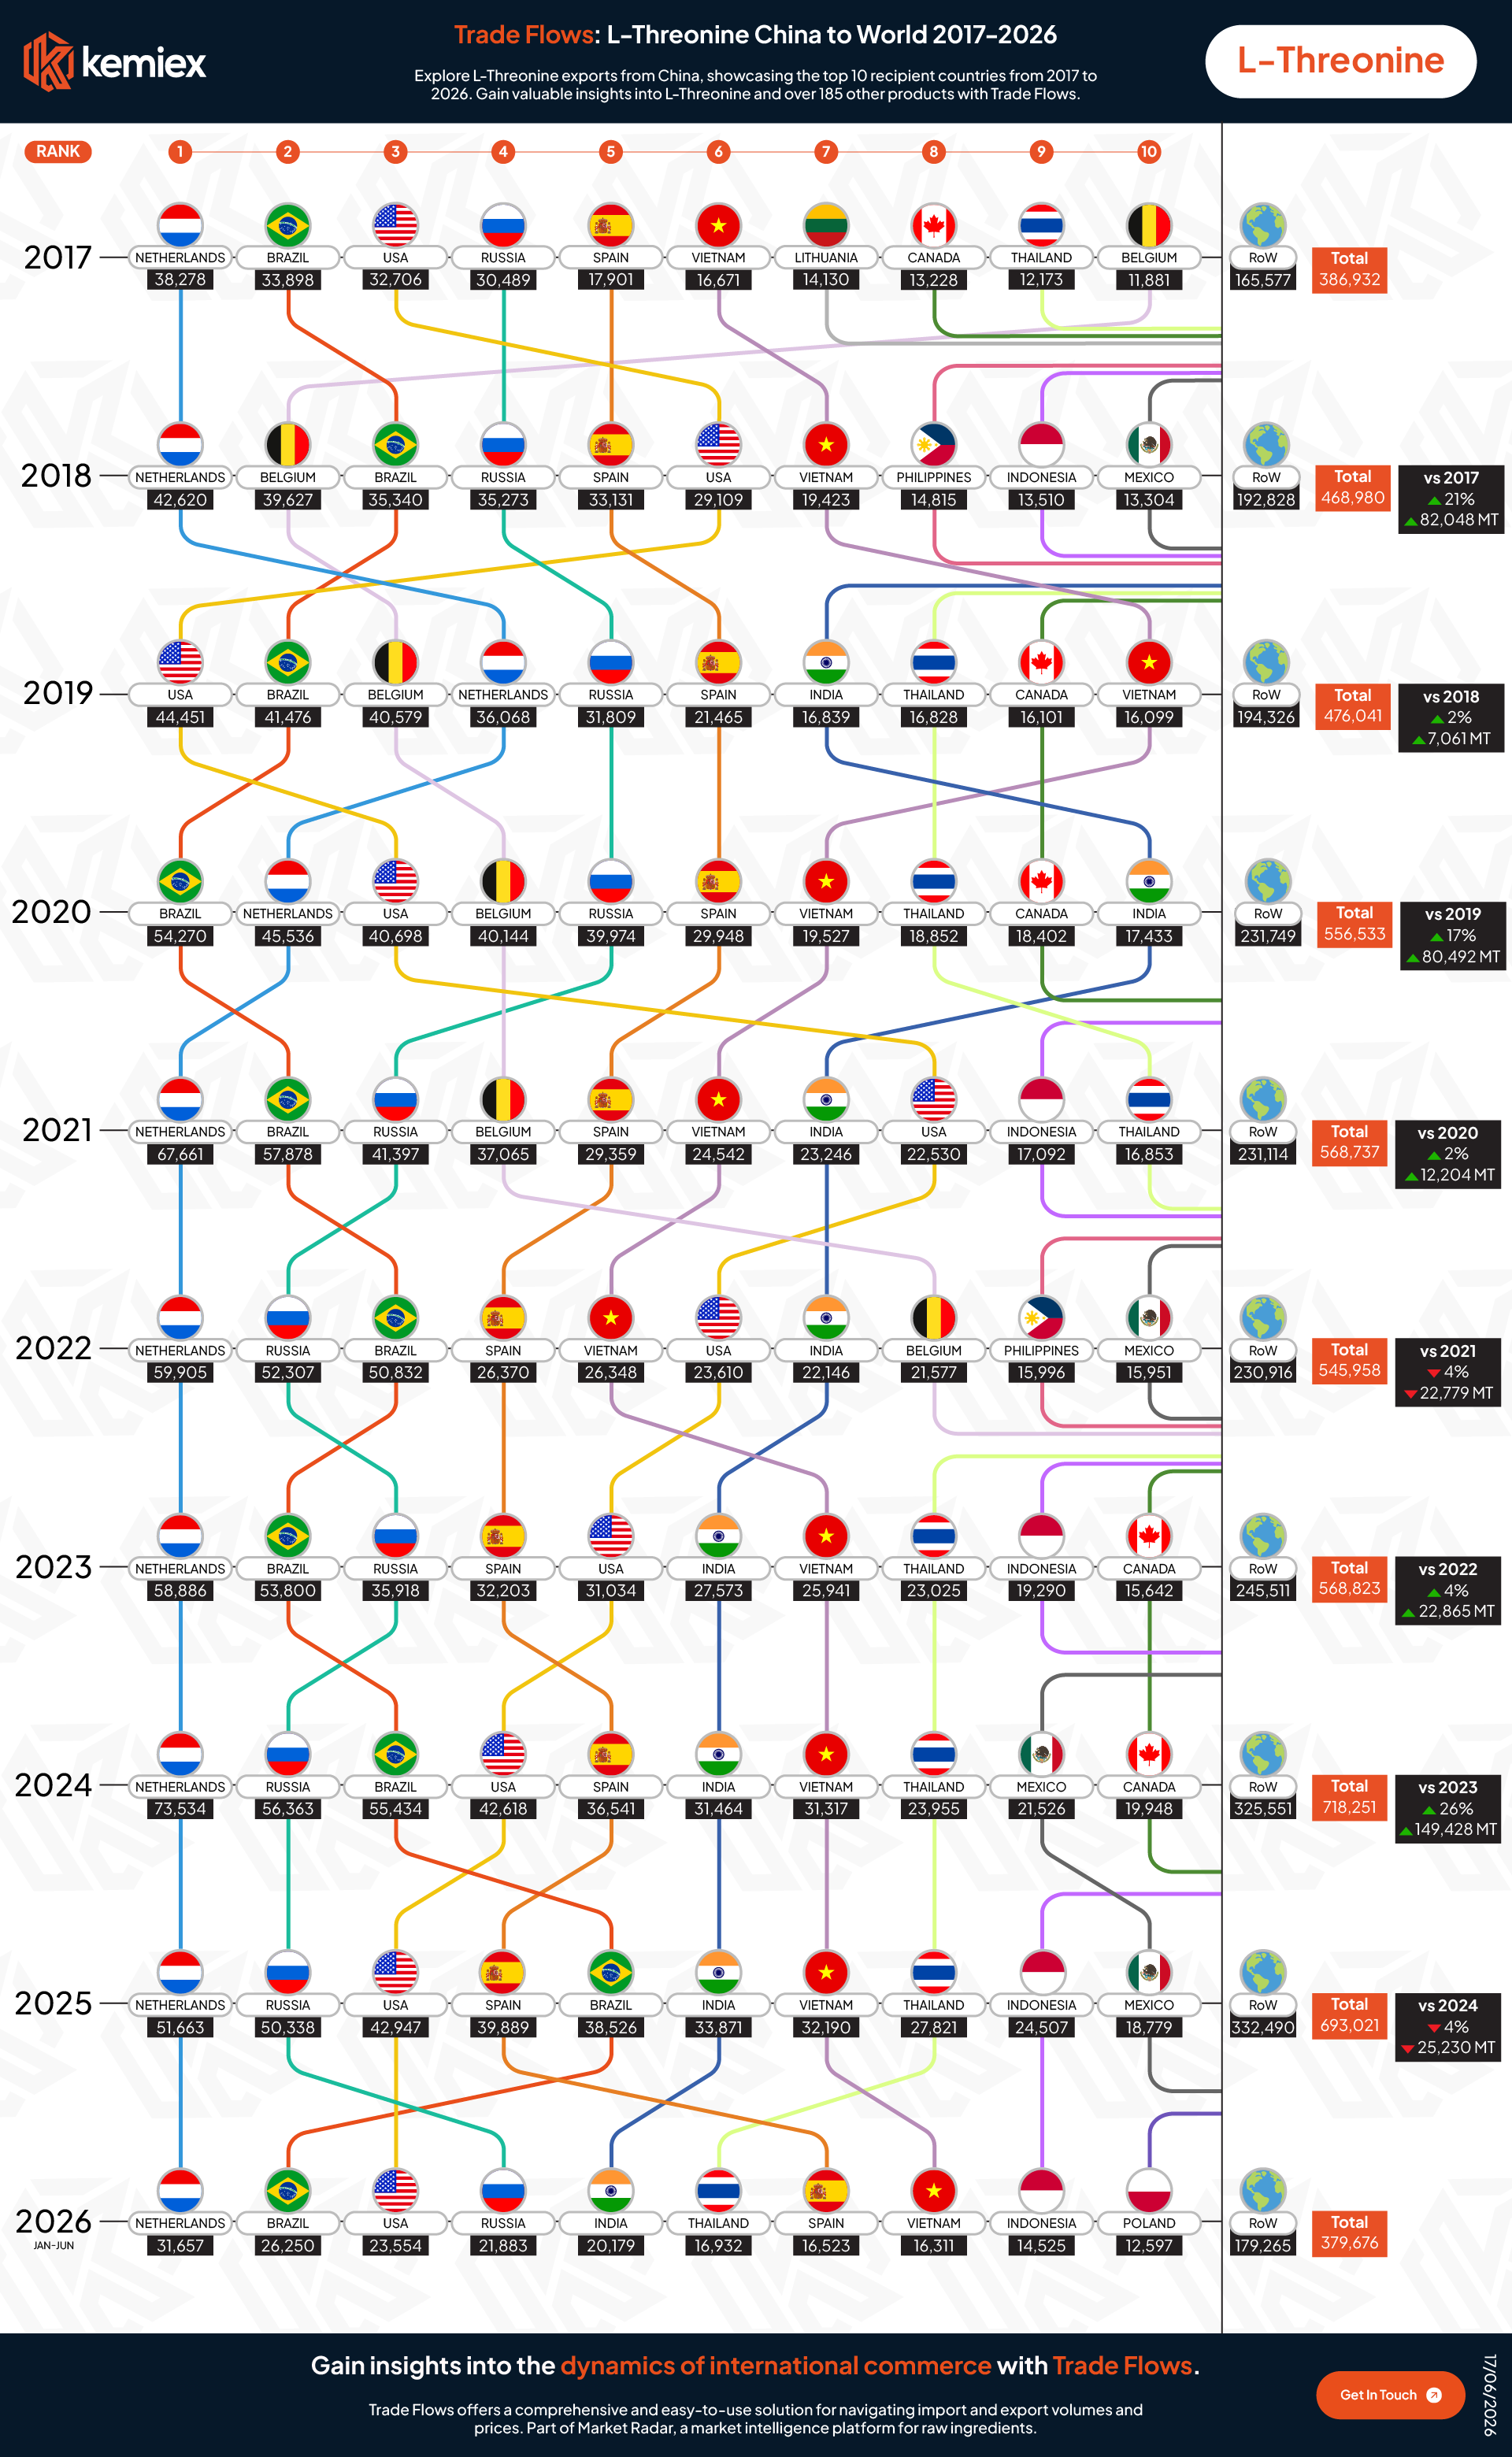
China L-Threonine exports volumes have grown by 79% since 2017
Total exports have risen from 386,932 MT in 2017 to 693,021 MT in 2025, with the increase concentrated in three years, 2018, 2020 and 2024.
The 2024 rise of 149,428 MT was by some distance the largest, and the 25,230 MT decline in 2025 reversed only a sixth of it.
Two of the ten periods show a fall, 2022 and 2025, and neither ran deeper than 4%.
Chinese L-Threonine exports by year, 2017 to June 2026
MT: metric tonnes. Source: Kemiex Trade Flows.| Year | Total exports, MT | Change on prior year | Outside top 10 |
|---|---|---|---|
| 2017 | 386,932 | 42.8% | |
| 2018 | 468,980 | +21.2% | 41.1% |
| 2019 | 476,041 | +1.5% | 40.8% |
| 2020 | 556,533 | +16.9% | 41.6% |
| 2021 | 568,737 | +2.2% | 40.6% |
| 2022 | 545,958 | -4.0% | 42.3% |
| 2023 | 568,823 | +4.2% | 43.2% |
| 2024 | 718,251 | +26.3% | 45.3% |
| 2025 | 693,021 | -3.5% | 48.0% |
| 2026, Jan to Jun | 379,676 | Part-year | 47.2% |
Buyers are pacing very differently in the first half of 2026
The half-year total sits at 55% of the 693,021 MT shipped in all of 2025, which gives a rough benchmark for reading individual destinations, given that 2024 divided almost evenly between its two halves.
Against it, Brazil is running at 68% and Poland at 71%, while Russia is at 44% and Spain at 41%, a spread wide enough that the aggregate strength conceals two large European and Eurasian markets buying well below last year’s rate.
India sits at 60%, and its 20,179 MT in six months already exceeds its full-year totals for 2019 and 2020, which puts it fifth on the current ranking after being absent from the top 10 in 2017 and 2018.
Growth is landing outside the largest destinations
Volumes classed as rest of world have grown from 165,577 MT in 2017 to 332,490 MT in 2025, taking their share from 42.8% to 48.0%, the widest in the series.
Two shifts sit inside that. Belgium ranked second in 2018 at 39,627 MT and fell to 9,500 MT in 2023, recovering to 15,080 MT in 2025 but staying below the tenth-place threshold throughout.
Poland moved the other way, entering the ranking in the current half-year after three years just outside it. A top 10 view captures less of this market each year, which matters for anyone pricing against reported destination volumes.
Trade flows covers import and export volumes and prices for more than 185 raw ingredients, including vitamins, amino acids, minerals and feed additives, with country level detail on origins and destinations. It sits within market radar alongside price benchmarks and market news.
If you want the full destination list behind these totals, including the markets sitting outside the top 10, or any of the other ingredients we cover, get in touch with our team.