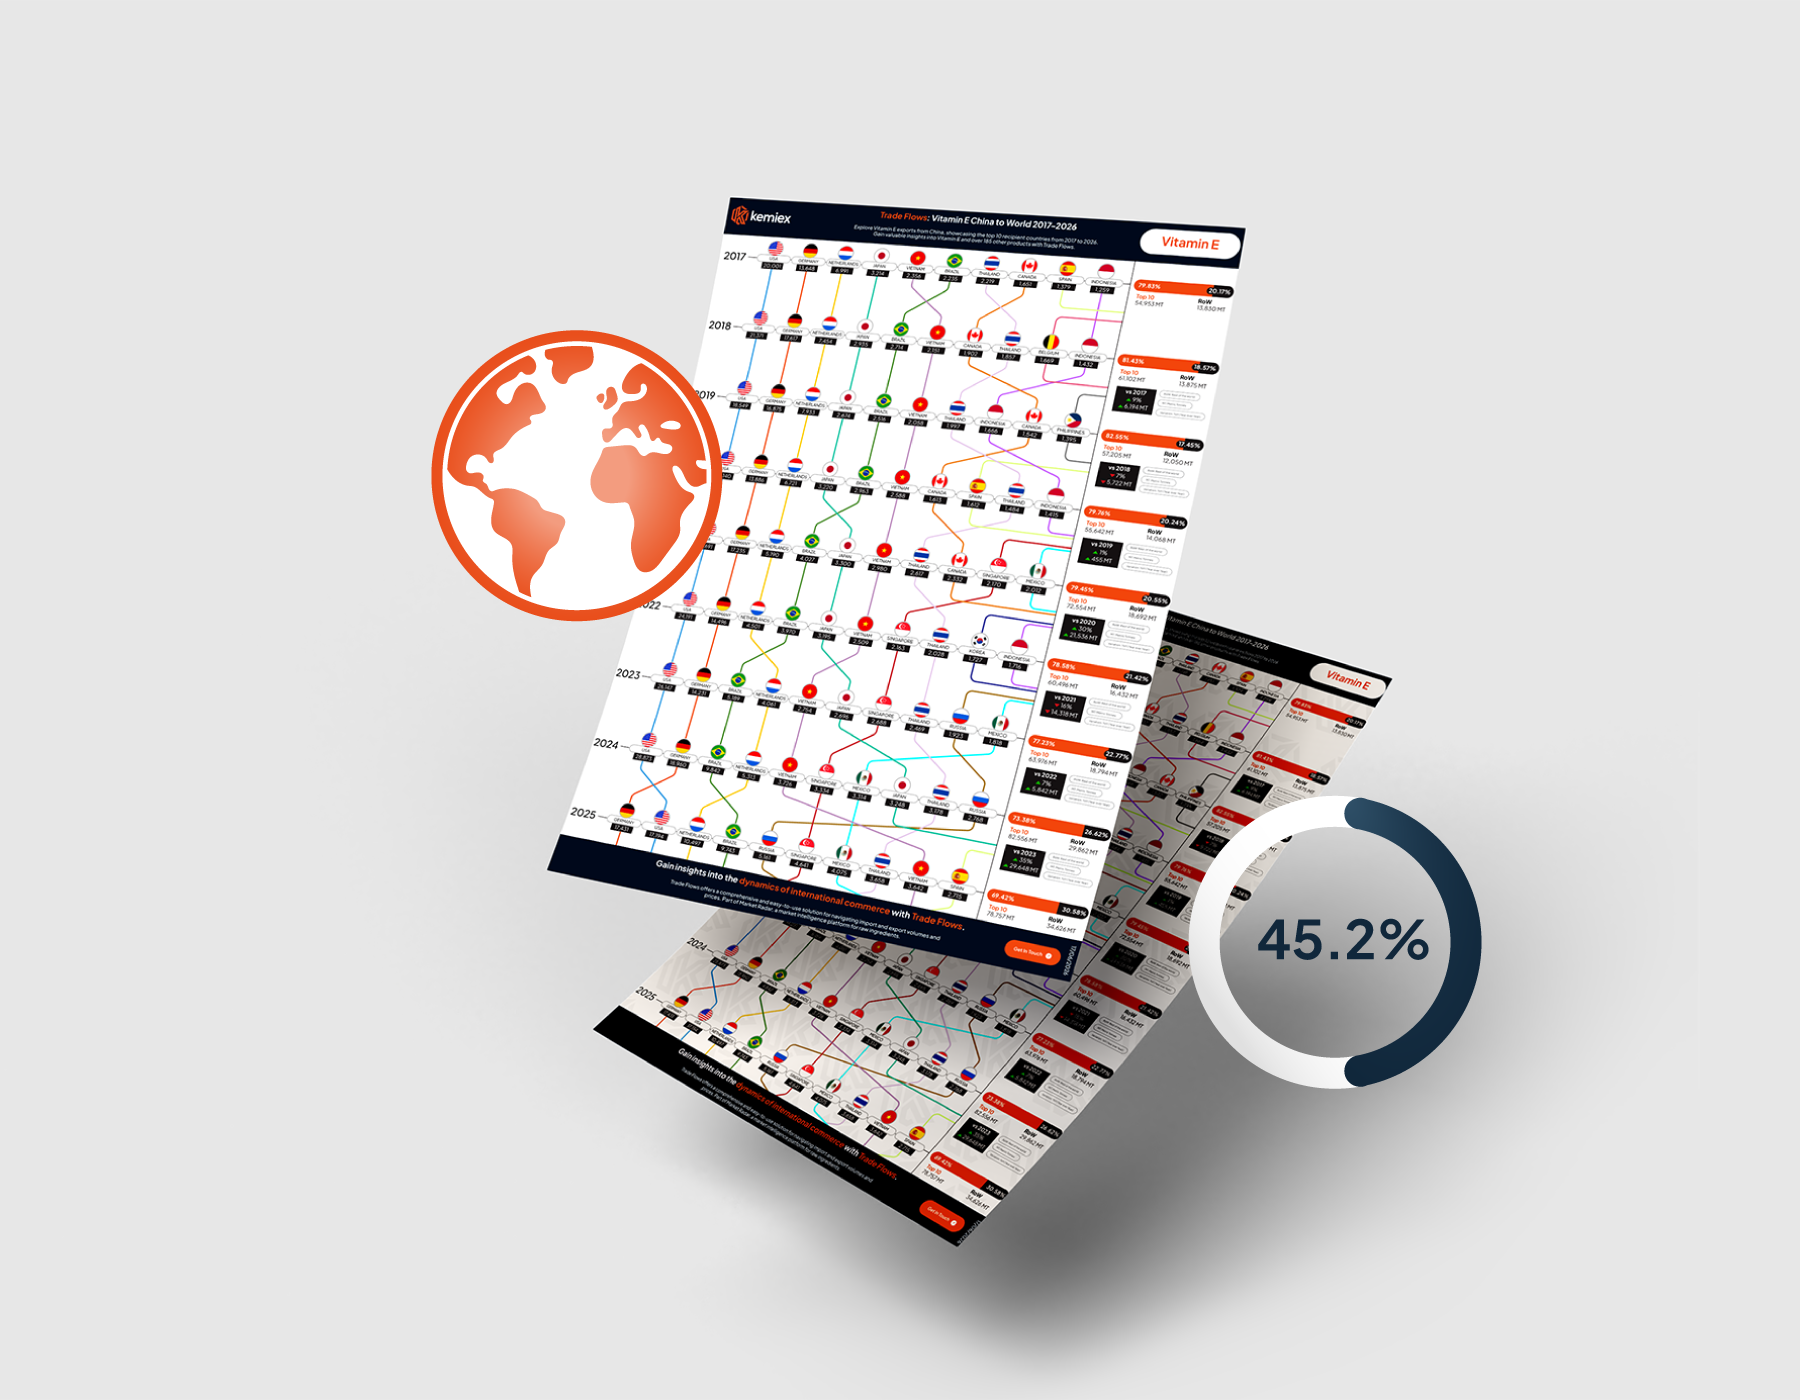
Key Takeaways
- Germany took the top destination slot in 2025 (and kept it in 2026) with 17,431 MT, ending eight consecutive years of US leadership by a margin of just 237 MT.
- US volumes fell from 28,873 MT in 2024 to 17,194 MT in 2025, a drop of 11,679 MT, or 40%, in a single year.
- The top 10 destinations accounted for 67.99% of Chinese Vitamin E exports in the first half of 2026, down from 82.55% in 2019.
Figures are drawn from Kemiex trade flows and cover Chinese Vitamin E exports from 2017 to June 2026, with 2026 representing January to June only.

The US decline is what moved the ranking, rather than German growth
Germany did not win the top slot by expanding.
German intake fell from 18,960 MT in 2024 to 17,431 MT in 2025, a decline of 8% while the USA fell by 40% over the same period, which is what closed the gap.
Total Chinese exports were broadly flat in 2025 at 113,383 MT, against 112,418 MT in 2024, so this was a redistribution of largely unchanged volume rather than a contraction.
The pattern held into the first half of 2026, when Germany and the USA sat 1,215 MT apart on volumes of 14,818 MT and 13,603 MT respectively. For buyers tracking landed availability in North America, that is one of the clearer signs of redirected trade flows in the dataset.
The top 10 now account for roughly two thirds of Chinese exports
Concentration has fallen every year since 2019.
The top 10 destinations took 82.55% of Chinese Vitamin E exports that year, and 67.99% in the first half of 2026, while rest of world volumes rose from 12,050 MT to 25,405 MT across the same comparison.
In practice, China is shipping Vitamin E to a longer list of destinations, and the marginal buyer is increasingly outside the traditional ten.
Vitamin E, China to World
| Year | Top 10 (MT) | Rest of world (MT) | Total (MT) | Top 10 share |
|---|---|---|---|---|
| 2017 | 54,953 | 13,830 | 68,783 | 79.83% |
| 2018 | 61,102 | 13,875 | 74,977 | 81.43% |
| 2019 | 57,205 | 12,050 | 69,255 | 82.55% |
| 2020 | 55,642 | 14,068 | 69,710 | 79.76% |
| 2021 | 72,554 | 18,692 | 91,246 | 79.45% |
| 2022 | 60,496 | 16,432 | 76,928 | 78.58% |
| 2023 | 63,976 | 18,794 | 82,770 | 77.23% |
| 2024 | 82,556 | 29,862 | 112,418 | 73.38% |
| 2025 | 78,757 | 34,626 | 113,383 | 69.42% |
| 2026 (Jan to Jun) | 54,363 | 25,405 | 79,768 | 67.99% |
Source: Kemiex Trade Flows. MT: metric tonnes. 2026 covers January to June only.
Russia, Brazil and the Netherlands are the structural gainers
Russia does not appear in the top 10 at all before 2023, when it entered at rank nine with 1,923 MT, and by 2025 it had reached rank five at 5,161 MT.
Brazil moved from 2,235 MT in 2017 to 9,842 MT in 2024, and the Netherlands recorded its highest volume of the period in 2025 at 10,497 MT, close to double the 5,313 MT of the year before.
Japan and Indonesia, both fixtures of the early rankings, are absent from the top 10 in 2025 and in the first half of 2026.
Netherlands volumes in particular should be read with re-export in mind, since Rotterdam serves as an entry point for wider European distribution rather than a final consumption market.
Trade flows covers import and export volumes and prices for more than 185 raw ingredients, including vitamins, amino acids, minerals and feed additives, with country level detail on origins and destinations. It sits within market radar alongside price benchmarks and market news.
If you want to know more about Vitamin E or any of the other ingredients we cover, get in touch with our team.